The legal requirement to "Save the Bay" is based on a Federal law, the Clean Water Act. The 1972 law was a major expansion of the requirements in the 1948 Federal Water Pollution Control Act. The law mandates that polluters must get permits before discharging any pollutant from a "point source" (basically, pipes or man-made ditches) into navigable waters, and provides authority for the Environmental Protection Agency (EPA) to establish standards for issuing/rejecting permits.
How clean is clean? That depends on what is defined as a "pollutant," and if the Chesapeake Bay has too much of those pollutants.
Litter is unsightly, and litter does not improve water quality, but litter is not killing the bay. Placing empty soda cans in recycling bins is environmentally responsible behavior, but recycling empty plastic water bottles and soda cans has no significant impact of the health of the Chesapeake Bay.
At different times, various forms of pollution have been major concerns - bacteria, pesticides, oil leaks from tankers, heavy metals, and acid mine runoff. Today, those threats are all relatively minor, though the Chesapeake Bay still receives excessive amounts of E.coli bacteria from cow manure, pesticides from suburban lawns and farms, mercury released into the atmosphere by coal-fired power plants upwind, plus estrogen and other hormones/antibiotics that human bodies have excreted and wastewater treatment plants have passed downstream.
Such contaminants affect the health of the plants and animals that live in the bay, but they are not the primary causes of the bay's problems. Recycling plastic water bottles is ecologically responsible, but will not solve the problem.
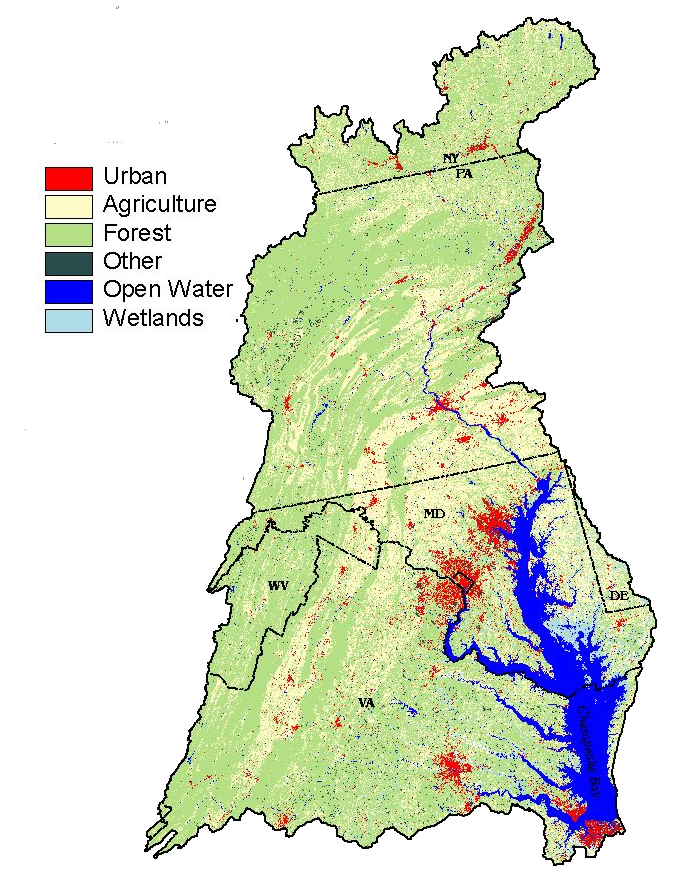
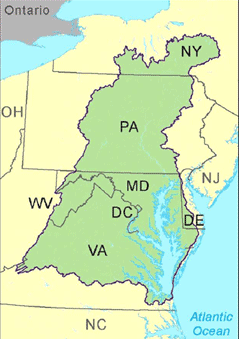
West Virginia, Pennsylvania, New York, Delaware, and the District of Columbia send pollution downstream to the bay, plus the two states (Virginia and Maryland) in which the bay is located
Source: Environmental Protection Agency (EPA), Chesapeake Bay TMDL
Two factors from farms, cities, and suburbs upstream are the primary causes of damage to the bay:
excessive sediment
excessive nutrients (nitrogen and phosphorus), triggering excessive algae growth
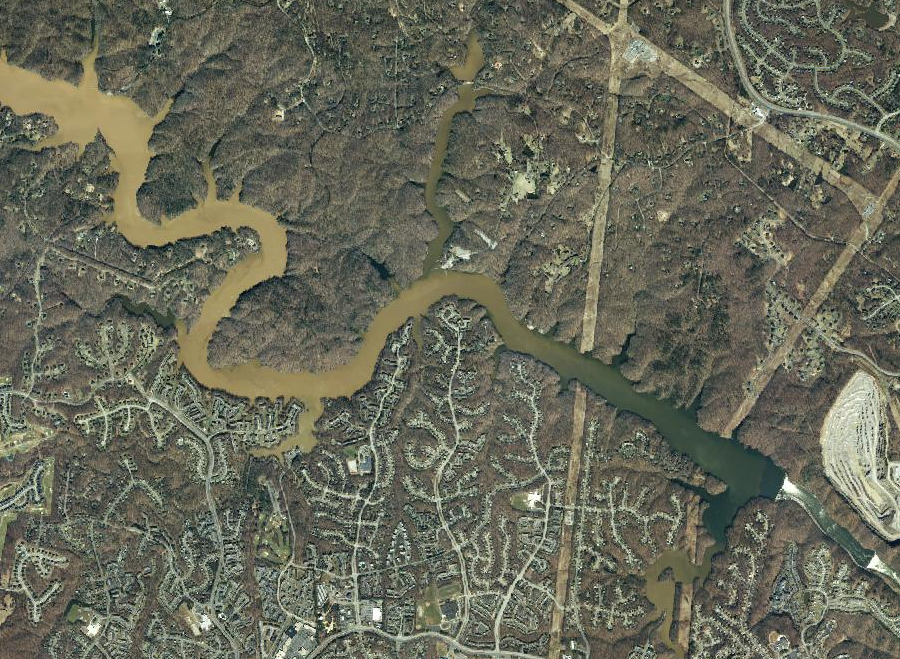
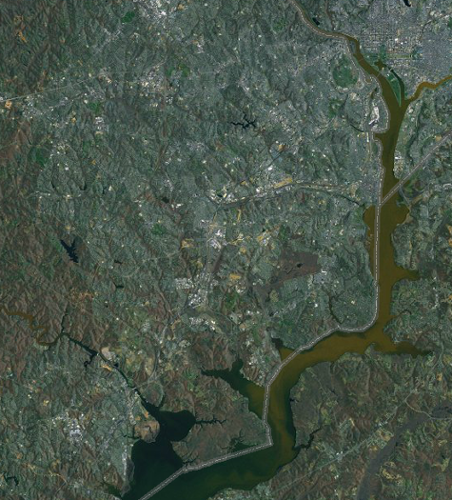
sediment suspended in the Occoquan River is trapped, briefly, when water speed is slowed by the Occoquan Dam
Source: Virginia Geographic Information Network (VGIN), VBMP 2011 WGS Web Mercator (VGIN)
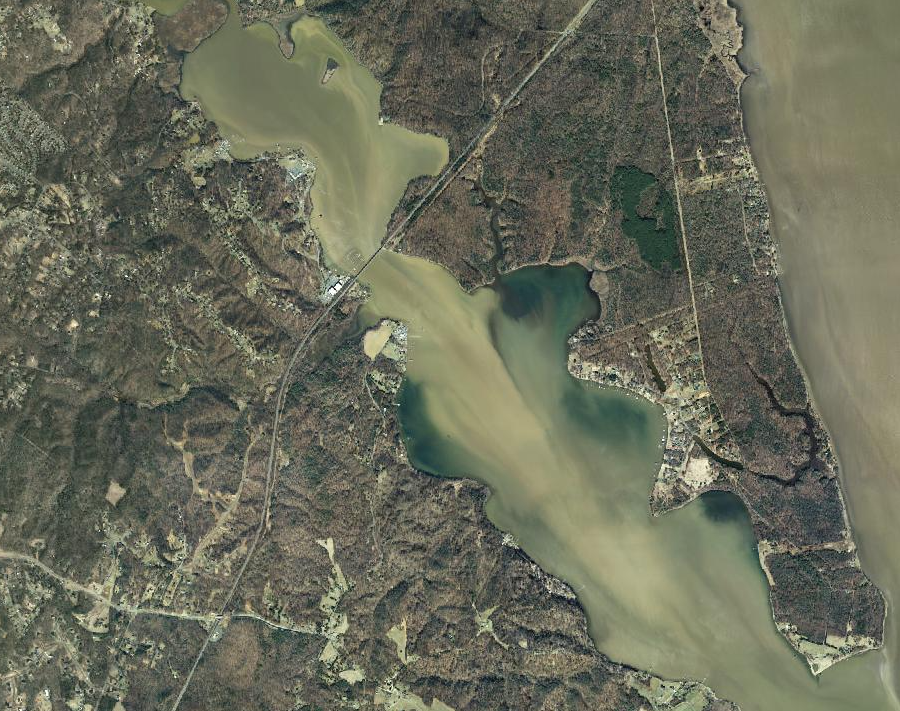
sediment suspended in Aquia Creek flows directly to the Potomac River and ultimately the Chesapeake Bay
Source: Virginia Geographic Information Network (VGIN), VBMP 2011 WGS Web Mercator (VGIN)
Reducing litter, heavy metals, chemicals, and bacteria would improve aesthetics and water quality, but the key to saving the bay is to reduce the input of two nutrients (nitrogen and phosphorus) plus sediment. Particles of sediment are especially troublesome. They carry nitrogen and phosphorus downstream, suffocate oysters and other creatures trying to live at the bottom of the bay, and block sunlight from reaching submerged aquatic vegetation.
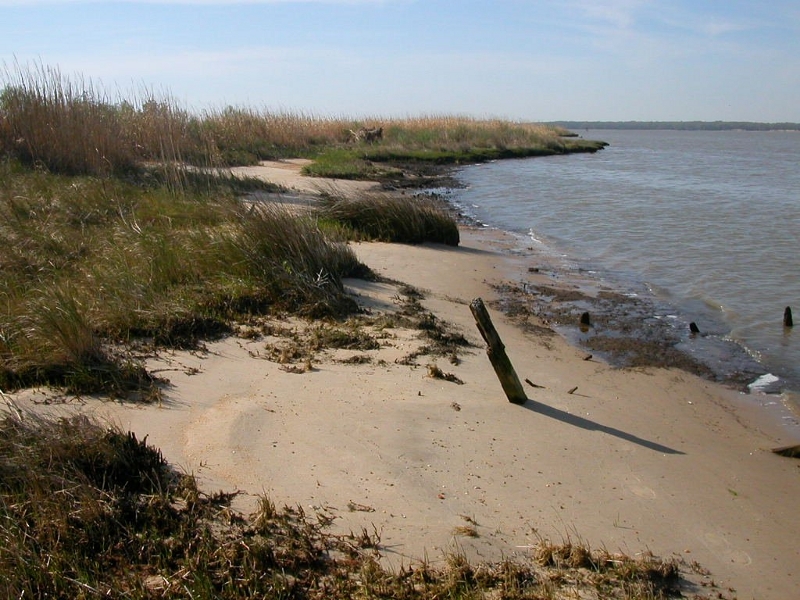
Since the 1930's, the sediments in stormwater and other pollutants have suppressed the marsh grasses (often Spartina species) and the underwater grasses (Submerged Aquatic Vegetation or SAV) that are essential to the health of the bay. The natural bands of SAV surrounding the points of land and islands have shrunk, and SAV has disappeared from extensive areas on the bottom of the Bay.
There is no secret regarding the cause. Silt from urban/suburban construction, plus erosion after the clearing of forests or plowing of cropland, has physically coated the SAV and blocked the transmission of light that is essential for plant growth. Once colonists began clearing forests and planting tobacco, the flow of silt increased, with so much deposition downstream that in some cases (such as at Dumfries) the colonial harbors were blocked.
After the 1983 Chesapeake Bay Agreement was signed, implementation of Best Management Practices for development upstream provided inadequate mitigation. Sediment continued to pour into the Chesapeake Bay after every major storm.
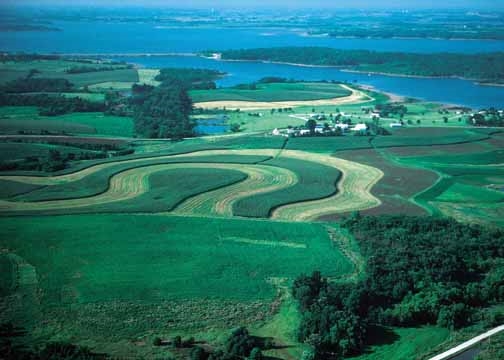
- For the entire Chesapeake Bay region, river basins with the highest percentage of agricultural land use have the highest annual sediment yields, and basins with the highest percentage of forest cover have the lowest annual sediment yields.
- Urbanization and development can more than double the natural background sediment yield; the increase in sediment yield is highest in the early development stages.
- After development is completed, erosion rates are lower; however, sediment yield from urbanized areas can remain high because of increased stream corridor erosion due to altered hydrology.
- Sediment plays an important role in transporting phosphorus and other contaminants in river systems. The amount of phosphorus depends on the source and on the geochemical reactions affecting phosphorus during transport.
- Most of the sediment from the watershed to the bay is transported when (1) streams reach bankfull conditions, which take place on average every 1-2 years, and (2) during relatively large storm events...
Adding fertilizer triggers grass to grow on suburban lawns. Force-feeding nutrients (nitrogen and phosphorus) into the Chesapeake Bay also triggers growth of algae and cyanobacteria (formerly known as blue-green algae). Algae/cyanobacteria, when alive and photosynthesizing, will produce oxygen during daylight hours - but after algae/cyanobacteria die, the decay process strips oxygen from the water.
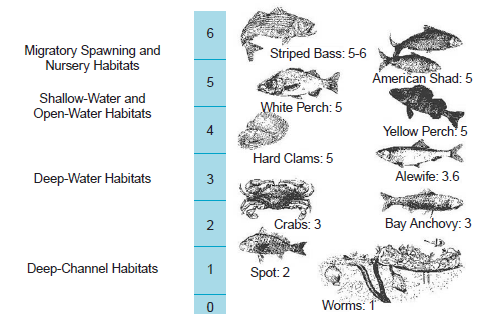
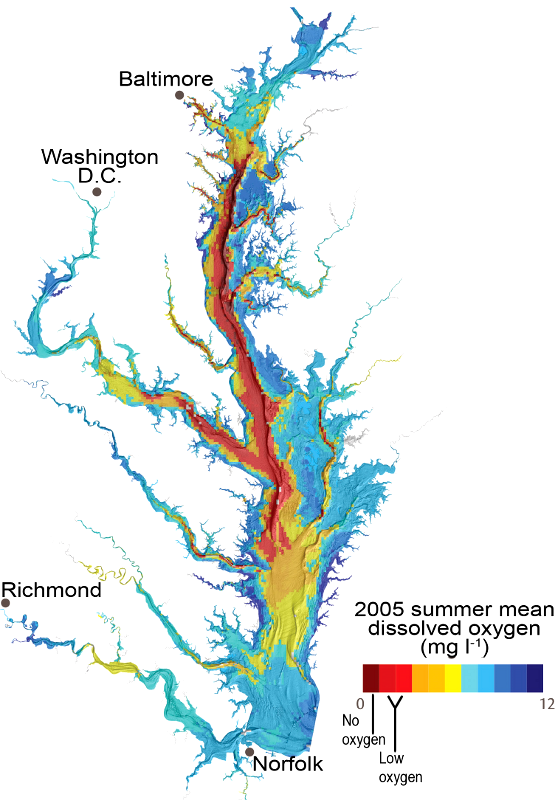
Excessive amounts of algae/cyanobacteria decomposing on the bottom of the bay results in excessively-low dissolved oxygen levels. Crabs, oysters, fish, and other living creatures need a certain level of dissolved oxygen in order to live underwater.
Only tube worms can survive at 1 milligram/liter. At lower levels, everything will die and the result has been "dead zones" in the deep channels of the Chesapeake Bay.
The Environmental Protection Agency has determined in a Total Maximum Daily Level (TMDL) study how much nitrogen, phosphorus, and sediment the bay can absorb. EPA has allocated limits for each pollutant to each of the states in the watershed, plus the District of Columbia.
For the Chesapeake Bay, impairment is measured by three specific water quality criteria: dissolved oxygen, water clarity and Chlorophyll A. Reducing nitrogen, phosphorus, and sediment levels in water flowing into the bay will affect the measurements of dissolved oxygen, water clarity and Chlorophyll A in the bay itself.
At some point, perhaps the year 2040, Virginia and Maryland plan to remove their portions of the bay from the Clean Water Act Section 303(d) list of "dirty waters." The states and EPA may declare success, claim the bay meets Federal water quality standards, and do nothing more. On the other hand, if pollutants such as heavy metals still result in the bay being listed as unsuitable for one or more of its designated uses, the states will have to continue to work at meeting Clean Water Act water quality standards.
There is a relationship between the three water standards (dissolved oxygen, water clarity, and Chlorophyll A) and the three major pollutants (nitrogen, phosphorus, and sediment).
Chlorophyll A measures the amount of algae and cyanobacteria (formerly known as blue-green algae) floating in the water. The higher the concentration of algae, the greater the level of Chlorophyll A. Using Chlorophyll A allows EPA to measure the impact of nutrients and sediments that are deposited in the Chesapeake Bay. High concentrations of algae/cyanobacteria and sediment in the water will also reduce the water clarity.
Virginia officials have challenged the use of the Chlorophyll A standard for the lower James River, since reducing that level will require upgrading wastewater treatment plants in the James River watershed. Reducing nutrients in the James River will affect primarily the river itself and the mouth of the Chesapeake Bay, so Virginia has argued that the $2 billion additional cost of meeting the Chlorophyll A standard will exceed the benefit.2
Based on the Clean Water Act, the Environmental Protection Agency (EPA) has developed a process for determining how much pollution a water body can absorb before violating water quality standards. In a Total Maximum Daily Load (TMDL) analysis, EPA determines the limits for different pollutants, and require polluters to reduce discharges below the TMDL limits so the water body meets standards for the six designated uses in Virginia:
In 1980, Virginia and Maryland established the Chesapeake Bay Commission, and Pennsylvania joined in 1985. The intent was to establish a state-based approach to managing the Chesapeake Bay. Excluding the Federal government increased the potential that state-to-state negotiations, rather than Federal mandates, could reduce pollution sufficiently.
In 1983, the EPA published Chesapeake Bay - A Profile of Environmental Change. That report documented the declining condition of the bay and emphasized that under the Clean Water Act, the Chesapeake Bay and its tributaries were required to meet Federal water quality standards.
The Federal law mandate for meeting water quality standards and the EPA report spurred the governors of Pennsylvania, Maryland, and Virginia (plus the mayor of the District of Columbia, the head of the EPA, and the head of the Chesapeake Bay Commission) to sign the 1983 Chesapeake Bay Agreement.
New Jersey is outside of the Chesapeake Bay watershed, and West Virginia, New York, Delaware within the Chesapeake Bay watershed did not sign the 1983 agreement
Source: US Fish and Wildlife Service, Chesapeake Bay Program
The 1983 Chesapeake Bay Agreement was signed on the Fairfax campus of George Mason University. That agreement did little more than create a Chesapeake Executive Council and state that future actions would be taken. Still, the agreement served as a starting point for a multi-state commitment to "do something" in order to comply with the Clean Water Act. The agreement also put everyone on notice that the Federal government would require action, and EPA would play a role.
sediment (and fresh water) washing downstream from DC to Mason Neck, after rainstorm (note that Virginia-Maryland boundary is not in middle of river)
Source: US Fish and Wildlife Service, Critical Habitat Mapper
Four years later, the signers of the 1983 Chesapeake Bay Agreement signed the 1987 Chesapeake Bay Agreement. In it, the signers specified actions they would take to clean up the bay. A key part of the 1987 agreement was the promise that the signing parties would reduce by 40%, the nitrogen and phosphorus entering the main stem of the Chesapeake Bay, and achieve that reduction by the year 2000.
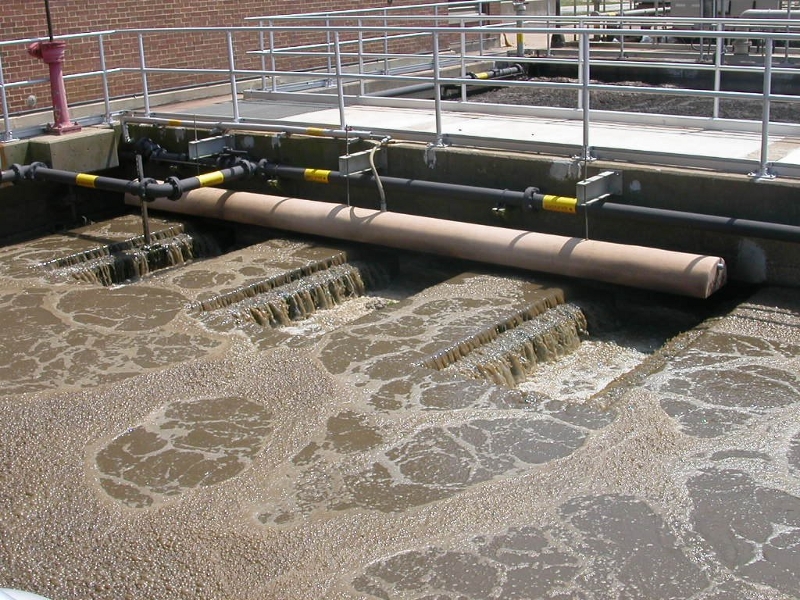
An obvious target for nitrogen reduction was human waste. Sewage includes high levels of nitrogen that was incorporated in cell walls of plants, but then excreted by humans. Human bodies have different membranes for cell walls, and do not absorb most of the nitrogen in plant food.
Natural nitrogen levels in freshwater streams in the United States average 0.14 mg/l (milligrams/liter). Those levels have been raised unnaturally by the use of fertilizer and burning of fossil fuels. Stormwater runoff from agricultural fields and deposition of nitrogen added to the atmosphere has increased nitrogen levels to 0.89 mg/l
The first wastewater treatment plants were designed to reduce levels of bacteria, but not to reduce levels of phosphorus or nitrogen. In freshwater tributaries and their estuaries along the Potomac River, phosphorus is the limiting nutrient. If phosphorus levels are too high, there is excessive growth of algae. In the Chesapeake Bay, nitrogen is the limiting nutrient. Reducing the amount of nitrogen flowing into the bay is essential in controlling excessive growth of algae.
Natural nitrogen levels in freshwater streams in the United States average 0.14 mg/l (milligrams/liter). Those levels have been raised unnaturally by the use of fertilizer and burning of fossil fuels. Stormwater runoff from agricultural fields, discharge of watewater, and deposition of nitrogen added to the atmosphere has increased background nitrogen levels to 0.89 mg/l.3
Through the National Pollutant Discharge Elimination System (NPDES) permit regulations, EPA required wastewater treatment plants to reduce nitrogen and phosphorus in their discharges.
Banning detergents with phosphorus had a major impact; that stopped the addition of much phosphorus whenever clothes were washed. In addition, chemical processes were implemented at wastewater treatment plants to extract most of the remaining phosphorus that was flushed from houses and businesses.
New "biological nutrient reduction" (BNR) technology was implemented at sewage plants. BNR systems used bacteria to convert excessive nitrates (NO3-) in human sewage into harmless N2 gas molecules that escaped into the atmosphere.
It was very expensive to upgrade old wastewater treatment plants and build new facilities that could eliminate nutrients as well as E. coli bacteria. Federal grants soothed much of the political pain, but ratepayers saw increased monthly bills for sewage treatment.
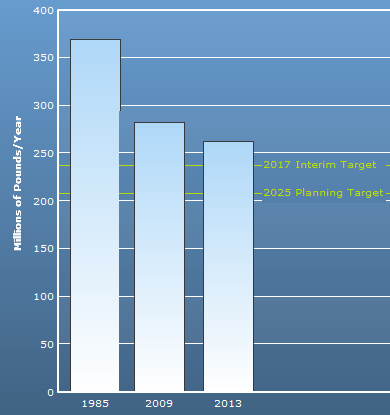
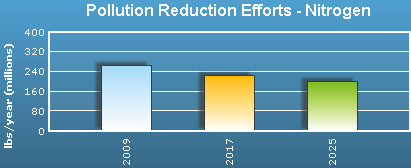
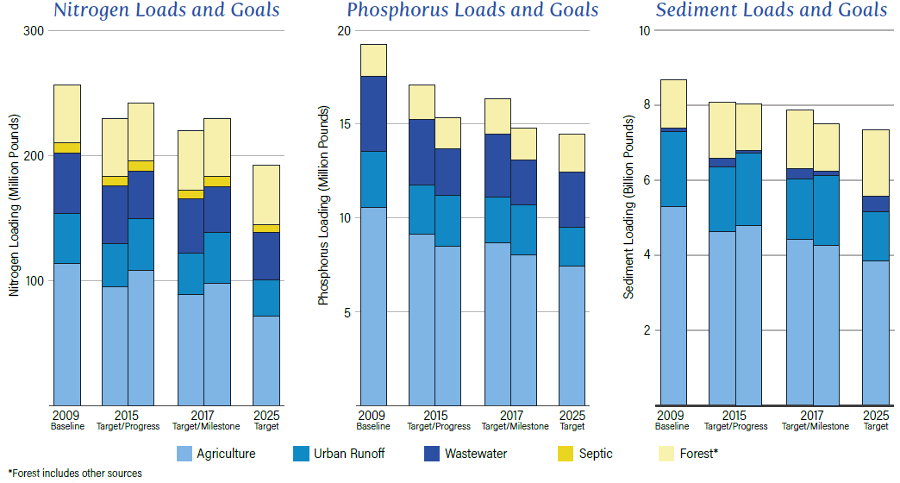
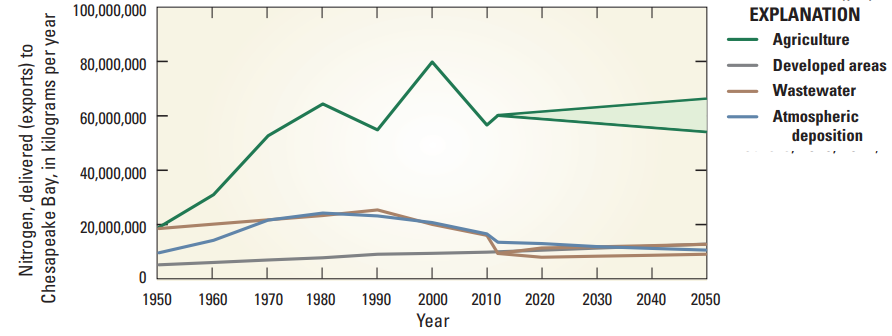
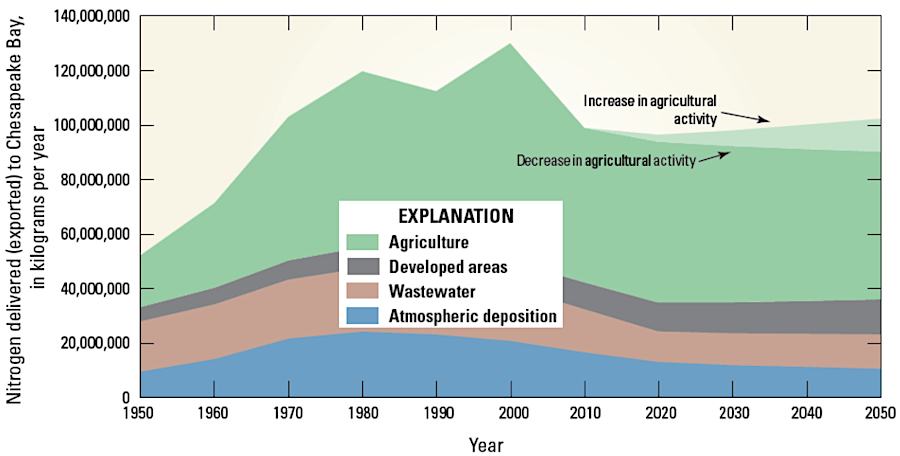
progress towards nitrogen reductions were not adequate by 2009, so the TMDL defined a schedule to reduce that pollutant (plus phosphorus and sediment) by 2025
Source: Chesapeake Bay Program, Nitrogen Loads to the Bay
There was wide public support for better water quality, but environmental advocates did not recognize how enlarging the capacity of facilities treating sewage would affect land use patterns. Developers welcomed the opportunity to expand sewage treatment capabilities, because expanded wastewater plants facilitated new development in the watershed. The "green" money that produced cleaner water also spurred the clearing of forests, and the conversion of farmland into suburbia throughout the Chesapeake Bay watershed.
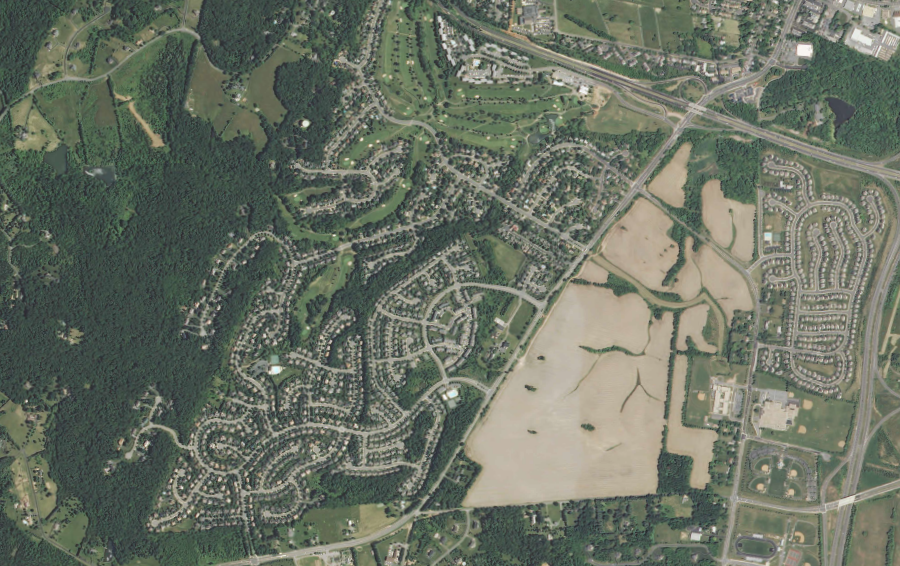
west of the Dulles Greenway in Loudoun County, new subdivisions dependent upon wastewater treatment plants are replacing fields and forests
Source: US Geological Survey, Leesburg 7.5x7.5 topographic map (2013)
To implement its 1987 promises, Virginia passed the Chesapeake Bay Preservation Act in 1988. State agencies issued regulations to enforce the state law in jurisdictions defined as "Tidewater" Virginia. That definition did not include the entire Chesapeake Bay watershed; most of the state west of the Fall Line was excluded. (For example, Loudoun County and points upstream on the Potomac River - including the entire Shenandoah River watershed - were excluded.)
To minimize how many local jurisdictions would be affected and thus minimize potential opposition to unfunded mandates, most of the acreage and most of the jurisdictions in Virginia's portion of the Chesapeake Bay watershed were excluded from the Chesapeake Bay regulations ("Ches Bay regs").
The state code lists 29 counties and 17 cities as being within the boundaries of Tidewater Virginia. Staff from the Virginia Department of Environmental Quality (DEQ) must deal with towns that have land use planning and permitting authority separate from the counties. Compliance reviews every five years involve assessing actions by 84 jurisdictions.
Fredericksburg and the counties of Stafford County, Prince William, and Fairfax must protect existing vegetated buffers along perennial streams, but the state's "Ches Bay regs" imposed no such requirement for development in the City of Manassas or the City of Manassas Park. Loudoun County and Fauquier County are not listed as being within Tidewater, at least for the Chesapeake Bay Preservation Act.4
as defined by the Code of Virginia, Loudoun County and the cities of Manassas and Manassas Park are not included within Tidewater
Source: based on Code of Virginia, Section 62.1-44.15:68
The initial regulations focused on avoiding new pollution. Existing sources of nitrogen, phosphorus, or sediment were left for a later day.
In the 1990's, Virginia developed its Tributary Strategies to address existing nutrients and sediment flowing into the tributaries, which then flowed to the bay. That approach was formalized in 1992 amendments to the Chesapeake Bay Agreement.
The Tributary Strategies recognized that the only way to reduce the pollution in the bay was to reduce pollution in the tributaries, before pollution got to the bay. If upstream jurisdictions treated wastewater, intercepted agricultural runoff enriched with nutrients, and reduced the volume of urban stormwater, then tributary streams might meet water quality standards. If the tributaries, such as the Potomac and James Rivers, delivered clean water to the bay without excessive levels of nitrogen, phosphorus, and sediment, then the bay itself might meet water quality standards someday.
If the tributaries delivered "dirty" water, however, the bay itself has little capacity to recover. The bay does get oxygenated through wind blowing across the water, and bacteria are killed when exposed to the sun's ultraviolet light, but the volume of pollution delivered by the tributaries exceeds the capacity of the natural processes in the bay to clean itself.
Streams flowing through farmland and suburbanized/urbanized areas are different from sewer systems. Sewer systems are artificial streams contained in pipes, and there are wastewater treatment plants at the end to reduce pollution flowing through the pipes. In contrast, water flowing through stormwater ditches along roads is not treated in equivalent facilities, nor is "non-point pollution" (runoff from farm fields, roads, or other developed land without a stormwater system).
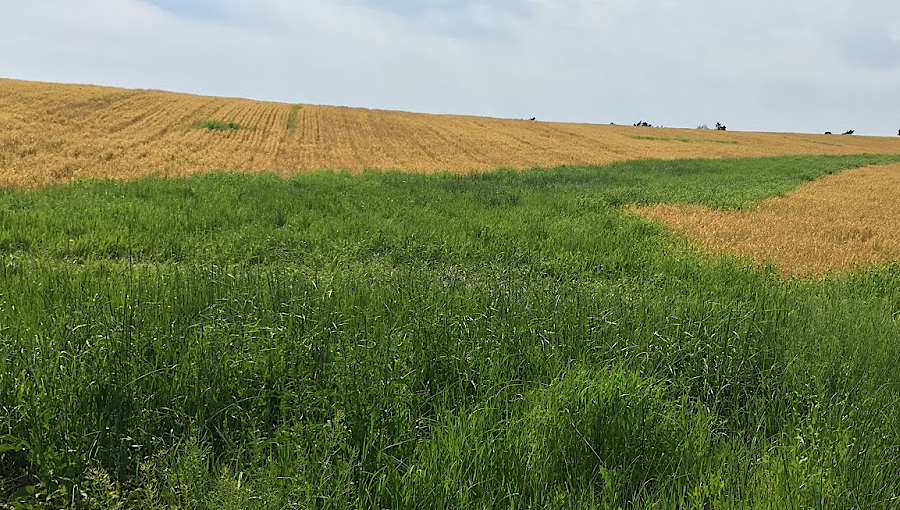
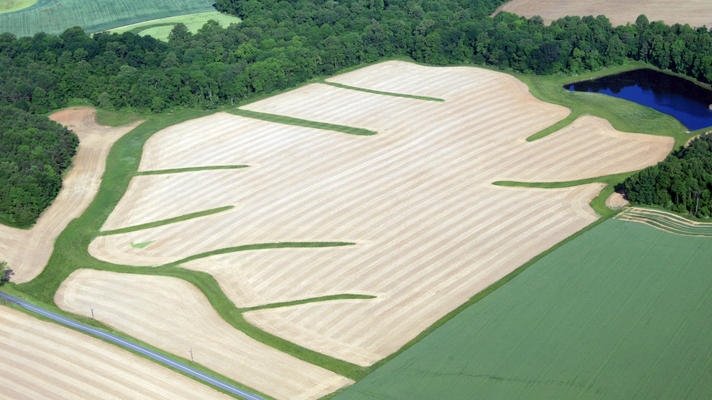
preserving vegetation in a Spotsylvania County farm's swale will reduce sediment running off the land towards the Chesapeake Bay
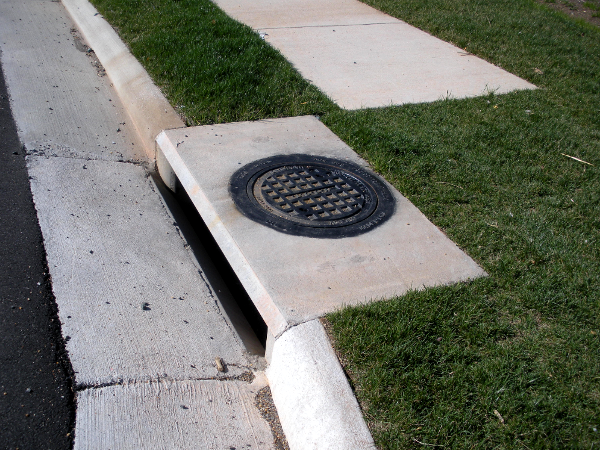
Rain that flows down a suburban or city gutter and enters a stormwater drain will flow directly to the Chesapeake Bay without being processed; stormwater is untreated. Wastewater facilities kill bacteria, remove nutrients, and eliminate sediments from the sewage piped from houses to wastewater treatment plants. Virginia even pipes sewage underneath the Potomac River to Blue Plains in the District of Columbia, which is the largest wastewater treatment plant on the Potomac River.
In contrast, runoff from farms, suburban yards, and parking lots does not flow through any human-built treatment plants (with three exceptions in Virginia that have Combined Sewer Overflow systems: Alexandria, Richmond, and Lynchburg).
Litter reveals the difference. Throw a cigarette butt into a toilet, and it will be caught at the wastewater treatment plant and end up in a landfill or incinerator. Throw a Styrofoam cup into a stormwater drain, and the cup will flow downstream, pushed in surges by different storms, until particles of Styrofoam reach the bay.
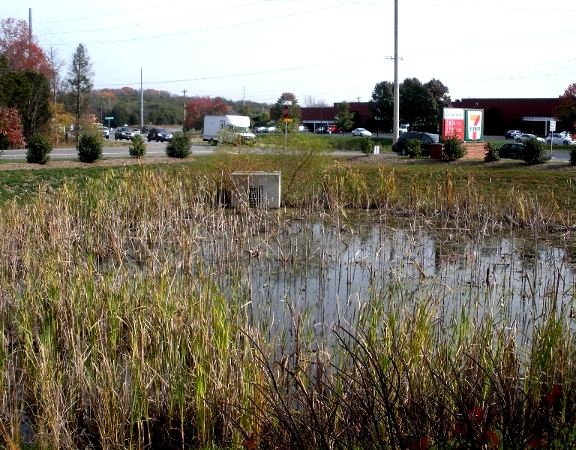
Other pollution in the stormwater will also flow to the bay; stormwater ponds produce insufficient nutrient reduction. Some debris and a small amount of sediment settles out in stormwater ponds temporarily, but later storms can send that material downstream in a pulse of pollution. Rapid suburbanization in the bay watershed has increased impervious surface, and runoff flows so fast that new sediment loads have overwhelmed the tributaries and the bay itself.
stormwater ponds are a "Best Management Practice" (BMP) for development - but whatever flows into a stormwater drain reaches the Chesapeake Bay, untreated
Though there are no treatment plants cleaning up the water at the end of natural rivers before they flow into the Chesapeake Bay, there are two natural processes that clean the bay's water - oxygenation by plants, and filtering by oysters and other wildlife. The dramatic declines in Submerged Aquatic Vegetation (SAV) and the oyster/menhaden population have eliminated key natural processes that once filtered the water column and increased dissolved oxygen in the bay.
The effort to "Save the Bay" is a cultural as well as physical geography story. All states in the Chesapeake Bay watershed have increased the ability of wastewater treatment plants to capture pollution before it flows into tributaries, but different states have chosen different ways to reduce sediment/nitrogen/phosphorus from non-point sources.
Maryland increased taxes and regulations to reduce non-point pollution from construction projects, farms, and existing developments. Landowners now pay annual fees based on the amount of impervious surface that sends water unnaturally fast downstream, and political campaigns often reference the "rain tax."
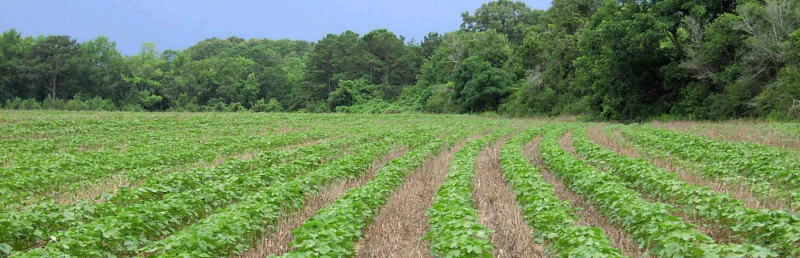
Virginia chose to rely upon voluntary action by farmers and land developers to reduce non-point pollution. State grants were directed to farmers in the Piedmont and Shenandoah Valley portions of the Chesapeake Bay watershed to implement "Best Management Practices" (BMP's), such as fencing cattle away from streams. Between the fences and streams, protected vegetated buffers intercept runoff and trap the nutrients from manure.
agricultural Best Management Practice (BMP), using grass strips to reduce runoff from plowed farm field
Source: University of Maryland, Integration and Application Network (IAN), Grassed waterways
The state could build wastewater treatment plants to treat stormwater flowing through urban gutters, but the most cost-effective technique to reduce pollution in streams is to prevent the pollution from entering the stream in the first place. The Tributary Strategies proposed in the 1990's were expected to stimulate wastewater plant operators, farmers, and developers to negotiate sediment/nitrogen/phosphorus reductions within each watershed until each tributary met the Clean Water Act requirements.
Virginia did adopt "Ches Bay regs" in Tidewater counties that required new developments with impervious surface to have lower impacts on streams. Those regulations mandated preservation of 100-foot buffers of undisturbed vegetation along each side of a perennial (flowing year-round) stream. The buffers were intended to serve as Resource Protection Areas (RPA's), using natural vegetation to capture a substantial percentage of the sediment, nutrients, and other pollutants before they entered the stream and ultimately flowed to the Chesapeake Bay.
where houses can be constructed is shaped by the Resource Protection Area (RPA) on Little Bull Run near Haymarket (Prince William County)
Source: Prince William County, County Mapper
RPA's affected land use at the local level, though only jurisdictions in Tidewater (as defined by the Code of Virginia) were required to identify and protect RPA's. Rezonings of specific parcels, site plan approvals, and inspection of building sites are actions taken by town/county/city officials rather than state/Federal officials. Federal/state efforts to "Save the Bay" have forced local government to adopt new requirements affecting development, and the "Save the Bay" efforts depend upon local governments to implement and enforce those requirements.
By 1999, it was obvious that the states and District of Columbia had failed to reduce nutrients and sediment enough to meet Clean Water Act water quality standards in the Chesapeake Bay. Since 1983, suburban development had continued unchecked in the Chesapeake Bay watershed, especially in Northern Virginia. Forests and fields, with slow runoff patterns, had been replaced by impervious surfaces where rainfall raced off rooftops/parking lots. The surging rush of rainwater carved into streambanks, etching new channels and carrying sediment downstream to the Chesapeake Bay.
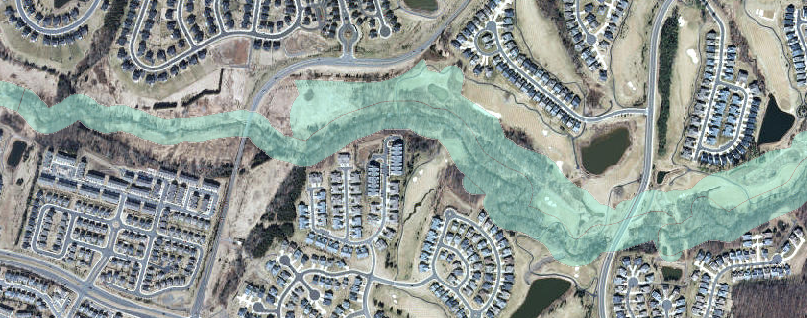
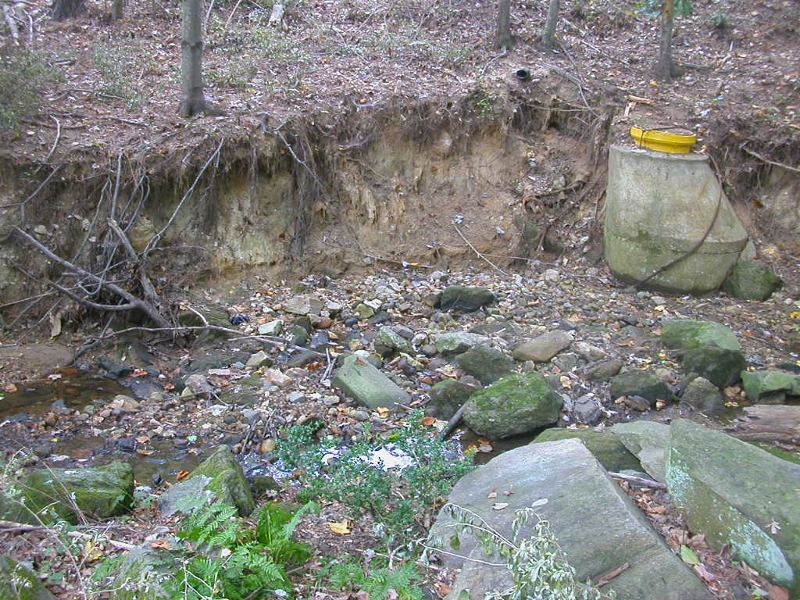
stream erosion caused by excessive stormwater running off impervious surfaces of suburban development,
transporting sediments downstream (Lake Ridge, Prince William County)
In addition to excessive levels of sediment, excessive levels of nutrients (nitrogen and phosphorus) continued to wash downstream into the Chesapeake Bay from wastewater treatment plants, fertilized lawns, and farms generating cattle and chicken/turkey manure.
In particular, Combined Animal Feed Operations (CAFO's) for poultry generated more manure than farmers could apply effectively as fertilizer on local fields. When applied at levels required to eliminate the need for nitrogen fertilizer, the phosphorus in the poultry manure exceeded the capacity of the soil to absorb it. Especially on the Eastern Shore, over-application of poultry litter resulted in excessive phosphorus enrichment of the Chesapeake Bay.
In 1999, two organizations (the American Canoe Association, Inc. and the American Littoral Society) sued in Federal court, claiming the states were not making sufficient progress. They requested a judge to force the states to meet the requirements of the Clean Water Act, and to force states to implement more than just voluntary action by polluters.
That lawsuit triggered the third signing of a Chesapeake Bay Agreement, replacing the 1987 version (as amended in 1992). In June, 2000, the District of Columbia, Maryland, Pennsylvania, Virginia, and the Environmental Protection Agency (EPA) signed the Chesapeake 2000 Agreement. In that document, the different levels of government promised to restore the water quality of the Bay, and the Chesapeake 2000 Agreement set objectives beyond just optional promises.
To settle the 1999 lawsuit, the parties agreed that the bay's water quality must improve and become "fishable and swimmable." If not, the Clean Water Act required EPA to list the Bay as "impaired waters" under Section 303(d) of the Clean Water Act. The government agencies agreed that such a listing would require the states and District of Columbia to craft a multi-jurisdictional limit on pollution, through the Total Maximum Daily Load (TMDL) process to protect the Bay's aquatic living resources.
The 1999 lawsuit and the Chesapeake 2000 Agreement set the stage for mandatory, Federally-guided action if the states were not able to make adequate progress on their own. The consent order, accepted by the states and EPA, resulted in a new Chesapeake 2000 Agreement, a promise to complete TMDL studies to define the acceptable level of pollution in Bay tributaries and the Bay itself, a new deadline allowing another 10 years to reduce pollution. By 2010, the bay was supposed to be so clean, EPA would not list it as an impaired water based on Section 303(d) of the Clean Water Act (the "dirty water" list).
After committing to the Chesapeake 2000 Agreement, Virginia continued to rely upon voluntary actions to mitigate existing pollution. Many news releases were issued in praise of small projects, and each theoretical reduction in pollution (as predicted by computer models) was highlighted as significant.
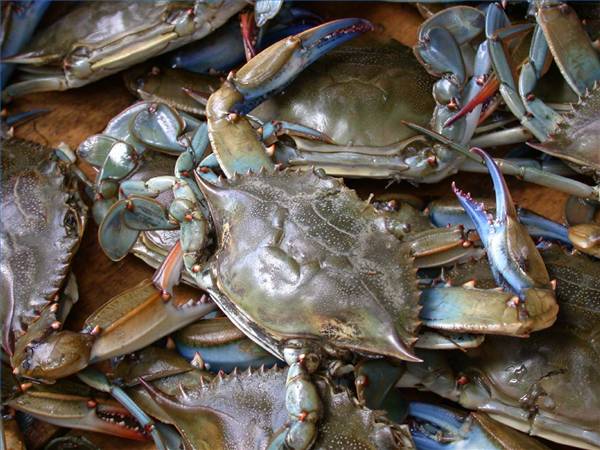
However, in 2008 the National Oceanic and Atmospheric Administration (NOAA) declared a "blue crab disaster" in the Chesapeake Bay, based on a 41 percent decline in harvest from the late 1990's. EPA's 2008 Bay Health and Restoration Assessment said "the overall health averaged 38 percent, with 100 percent representing a fully restored ecosystem."
By 2009 it was obvious once again that the deadline to remove the Chesapeake Bay from the dirty waters list would be missed.5
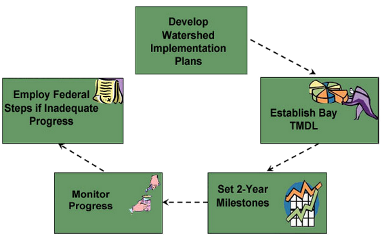
In 2010, a Federal judge ruled that the states and District of Columbia had failed to meet the terms in the 1999 consent order. The judged ordered EPA to complete a study that defined a Total Maximum Daily Load (TMDL) for the various segments of the Chesapeake Bay. The TMDL study allocated total amounts of sediment, nitrogen, and phosphorus reductions (a "pollution diet") to the various states. Each state and the District of Columbia then developed a Watershed Implementation Plan (WIP) to implement the required reductions.
Those Watershed Implementation Plans identified specific actions that would be completed, with milestones to be measured by EPA every two years. If a state failed to make progress, EPA defined "backstop" measure to implement on its own initiative.
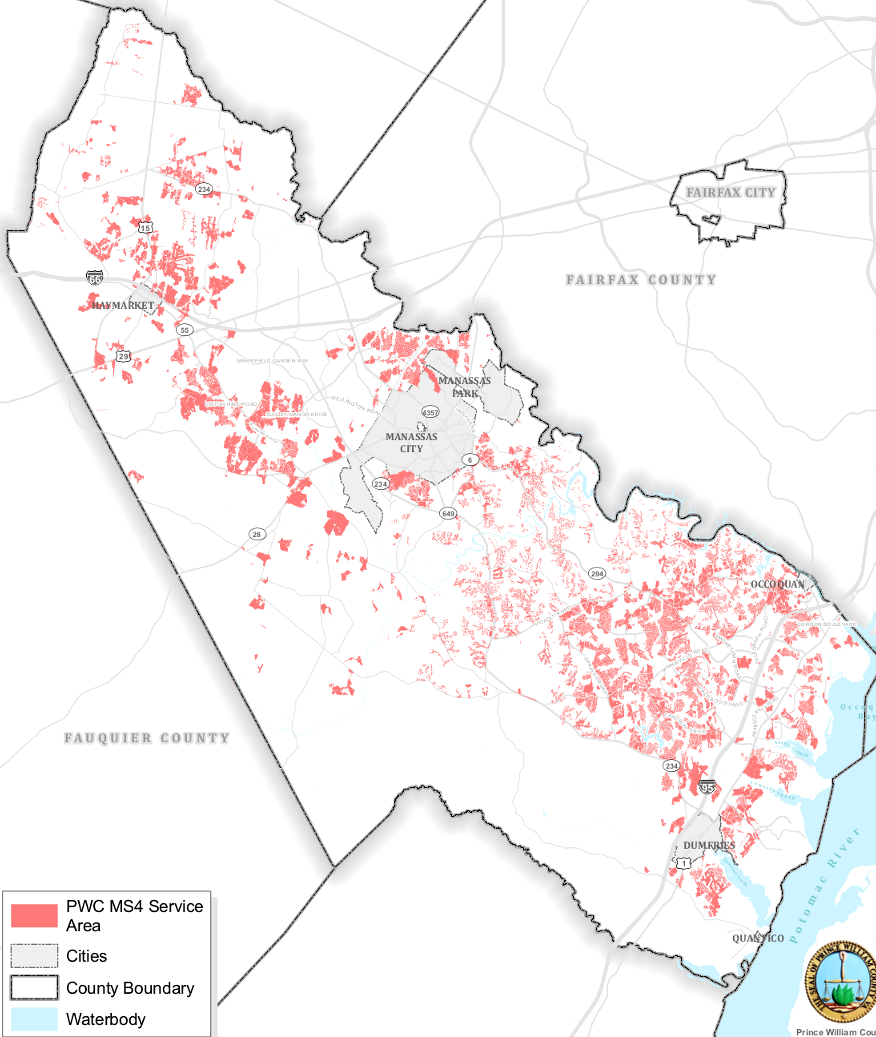
One backstop was to set a lower pollution threshold for permitted Municipal Separate Storm Sewer System (MS4) systems. EPA's leverage: if a state was unable to reduce polluted runoff as planned from private agricultural lands, local/state agencies would have to cut pollution from urban/suburban MS4 stormwater systems to make up the difference.
Virginia did not choose to divide up its total pollution budgets and allocate certain amounts to individual jurisdictions. The Chesapeake Bay computer models lacked the capability to provide such granular detail with any reliability, so the state did not establish quantifiable jurisdiction-specific thresholds for nitrogen, phosphorus, and sediment generated by from different towns/counties/cities. Instead, the Virginia Watershed Implementation Plan simply required local jurisdictions to implement Best Management Practices, such as nutrient management plans for publicly-owned land.
blue crabs - one reason people who do not have waterfront property might be motivated to Save the Bay
Source: National Park Service
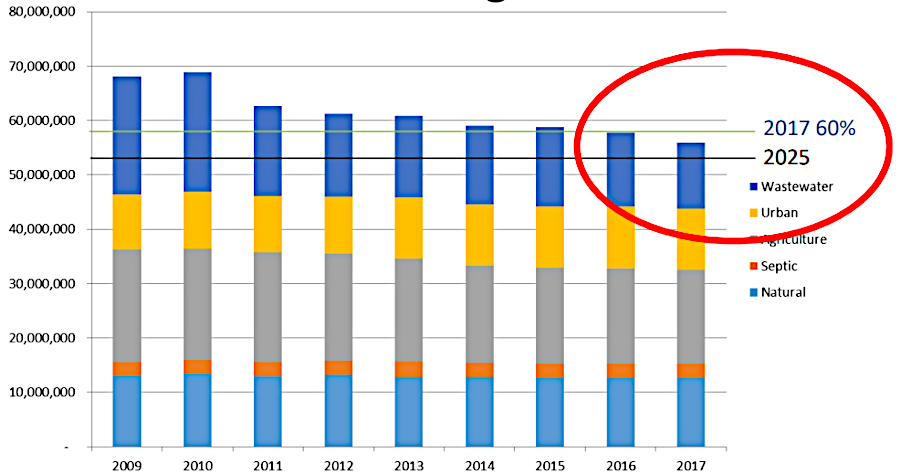
Virginia's first Watershed Implementation Plan identified a Phase I so the state would reach 60% of the required reductions of sediment, nitrogen, and phosphorus by 2017. The remaining 40% would be eliminated by 2025, as described in the Phase II Watershed Implementation Plan.
The Phase II WIP identified the total amount of nitrogen, phosphorus and sediment that could be sent downstream to the Chesapeake Bay by jurisdictions with Municipal Separate Storm Sewer System (MS4) permits. Jurisdictions exceeding those thresholds had to implement specific projects and programs to reduce their excess.
During the 2013-2018 permit cycle, according to the Phase II WIP, action strategies had to be implemented (not just planned) to achieve a 5% reduction. An additional 35% reduction was required during the second permit cycle (2018-2023), and the final 60% had to be completed during the third permit cycle (2023-2028).
Prince William County and other jurisdictions with Municipal Separate Storm Sewer System (MS4) permits must reduce stormwater runoff loaded with nitrogen, phosphorus and sediment
Source: Prince William County, MS-4 Service Area Map
The initial action strategies in Virginia's Phase I WIP included:6
- implement resource management plans on most agricultural acres, including 35 foot grass/forest buffers between cropland and perennial surface waters and excluding livestock from streams
- apply nutrient management planning to all state lands, municipal/county owned nonagricultural lands, golf courses, and 75% of dairies below the threshold for Concentrated Animal Feeding Operation (CAFO) regulation
- limit phosphorus in do-it-yourself, non-agricultural lawn and turf fertilizers used by homeowners
- develop a Nutrient Credit Exchange program to allow wastewater treatment plants with more-than-required reductions to sell credits to those unable to meet the mandates, at least for the short term
- reduce nitrogen in wastewater generated by all new small alternative onsite systems (AOSS's) in the Chesapeake Bay watershed, requiring all new and replacement systems in the Chesapeake Bay watershed to utilize either (1) shallow-placed systems capable of reducing nitrogen loss or (2) denitrification technology to reduce nitrogen loss
- establish 5 year pumpout requirements for septic tanks in jurisdictions within Virginia's Chesapeake Bay watershed, expanding the pumpout requirement already established for Chesapeake Bay Preservation Act areas
EPA requires reports every two years on the success/failure on state-based Watershed Implementation Plans
Source: Environmental Protection Agency (EPA), How Does It Work? Ensuring Results
Starting the 2005, the Virginia Nutrient Credit Exchange Association ended up as a voluntary association of 73 owners of 105 treatment facilities. By 2012, the major wastewater treatment plants had far exceeded their targets for reducing nitrogen, and the Environmental Protection Agency (EPA) recognized Virginia as the "biggest loser."
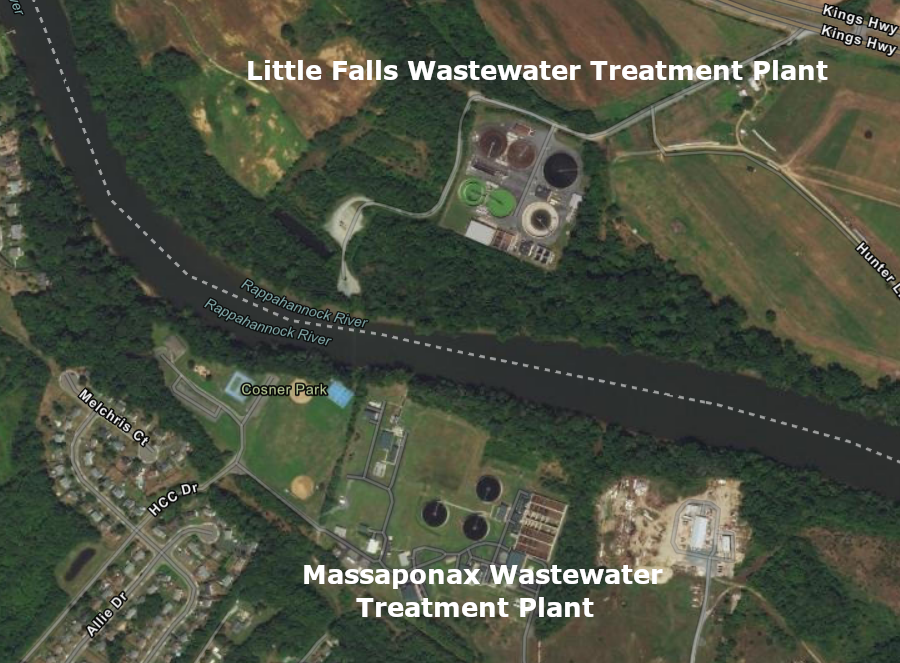
An example of a nutrient credit exchange was demonstrated by the City of Fredericksburg and Stafford County in 2022. The Little Falls Run Wastewater Treatment Plant regularly eliminated more than its required amount of nitrogen and phosphorus. Fredericksburg needed additional reductions in those two nutrients in order to meet the standards set in its Municipal Separate Stormwater Sewer (MS-4) Permit. Both jurisdictions were in the Rappahannock River watershed.
They signed a five-year contract to transfer 1,000 pounds of nitrogen credits and 200 pounds of phosphorus credits from Stafford County to Fredericksburg each year, as authorized by Virginia's Chesapeake Bay Watershed Nutrient Credit Exchange Program. The city agreed to pay up to $25,000 for the credits.7
the Little Falls Wastewater Treatment Plant in Stafford County was just across the river from a similar facility in Spotsylvania County
Source: ESRI, ArcGIS Online
Since population in the watershed will continue to grow, saving the bay will require reducing the pollution produced per person by more than 20-25%. "Business as usual" will not be adequate. Simply recycling plastic bottles will not be adequate. Even with substantial changes in farming practices, urban/suburban development, as wastewater processing, restoration will take decades. As described by EPA in their Frequently Asked Questions about the Bay TMDL:8
Q. How are the pollution limits set and what are those limits?
A. The TMDL sets pollution limits necessary to meet applicable water quality standards in the Bay and its tidal rivers. Specifically, the TMDL set Bay watershed limits of 185.9 million pounds of nitrogen, 12.5 million pounds of phosphorus, and 6.45 billion pounds of sediment per year. That represents a 25 percent reduction in nitrogen, 24 percent reduction in phosphorus and 20 percent reduction in sediment.
Q. When does the TMDL anticipate the Bay will be restored?
A. The TMDL is designed to ensure that all pollution control measures needed to fully restore the Bay and its tidal rivers are in place by 2025, with practices in place by 2017 to meet 60 percent of the necessary pollution reductions. While it will take years after 2025 for the Bay and its tributaries to fully heal, EPA expects some areas of the Bay will recover before others and there will be gradual and continued improvement in water quality as controls are put in place around the watershed.
in no-till farming, weeds are killed with chemicals and soil is not disturbed by plowing, reducing erosion of sediments
Source: US Department of Agriculture
Degrading the water quality took about a century, and restoration may not be declared successful until the middle of the 21st Century. If progress is acceptable, then by 2025 all mitigation measures are supposed to be in place... and sometime later, the Chesapeake Bay may recover.
For example, it will require decades before alterations of agricultural practices on the Eastern Shore will reduce nitrogen and phosphorus levels reaching the bay. There are already excessive amounts of nitrogen polluting the groundwater, and excessive amounts of phosphorus in the soils added through application of chicken manure as a fertilizer. Those nutrients will continue to be transported to the Chesapeake Bay each year.
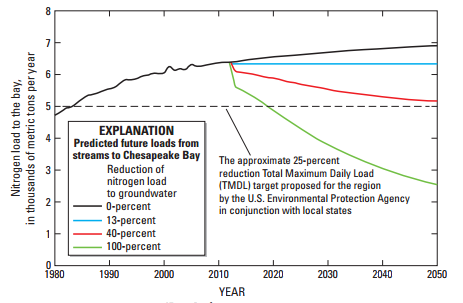
About 50% of the Eastern Shore is used for agriculture, so proposed reductions in the use of fertilizer to reduce future nitrogen/phosphorus pollution would have immediate impacts on the profitability of farming. The US Geological Survey estimates that substantial reductions of nitrogen - a major political challenge to achieve - would not meet the proposed Total Maximum Daily Load goal until the year 2050. A 40% reduction:9
would be insufficient to reduce annual nitrogen loads from the peninsula to Chesapeake Bay to an estimated 5,000 metric tons, the U.S. Environmental
Protection Agency (EPA) target for bay restoration, within the next 35 years.
If states fail to make adequate progress towards limiting pollution, EPA may impose "consequences" or "backstops," such as tighter pollution limits in NPDES permits for stormwater systems. Backstops are expected to create enough pain to force states to make politically-difficult choices that reduce pollution, even though the reductions would upset politically-powerful interest groups.
To increase public support for tough decisions by the states, various groups are conducting outreach efforts are asking people who live far from the Chesapeake Bay shoreline (but still in the watershed) to increase their advocacy for saving the bay. Those outreach efforts to places such as the Shenandoah Valley highlight the value of seafood from the bay, such as blue crabs. The assumption is that most people away from the shoreline have only a marginal interest in the bay's problems, so discussion of the science or the economic reasons to reduce pollution would have no impact - but those people could be motivated if "saving the bay" meant "saving a seafood dinner."
The dramatic declines in the harvest of fish, oysters, and crabs over the last 80 years has transformed the economics of waterfront communities. Most of the watermen who once made a decent living from crabbing, fishing, and especially tonging/dredging oysters are unable to make a living from the bay now. As the children in the families of watermen get out of high school and choose to enter college or other professions, a 300-year old way of life on the Bay is nearing extinction.
Virginia relied upon voluntary efforts to "Save the Bay" for 25 years after signing the 1983 Chesapeake Bay Agreement. The political power of urban areas and farm-dominated rural counties in Virginia successfully blocked regulation of subdivision development and traditional farming practices.
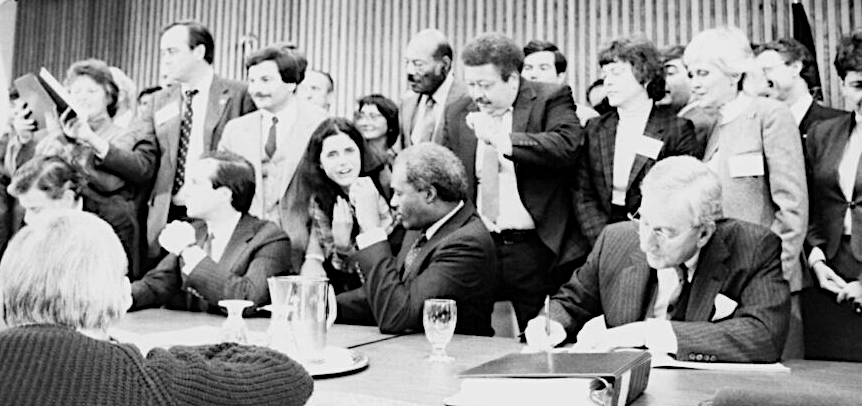
Joseph Gartlan, Jr., chair of the Chesapeake Bay Commission, signing the original Chesapeake Bay Agreement at George Mason University on December 9, 1983
Source: Chesapeake Bay Program, Eleven stories to round up our 40th anniversary year
As a result of delay, the economy and social patterns of waterfront communities along the shoreline of the Chesapeake Bay were damaged by unchecked urban sprawl in Hampton Roads and Northern Virginia/Southern Maryland, and by agriculture in the Shenandoah and Susquehanna river valleys.
Virginia adopted mandatory controls on pollution, effective enough to allow the bay to recover, only after a Federal judge ruled in 2010 that the Federal government could force compliance with the Clean Water Act. The Environmental Protection Agency (EPA) established a Total Maximum Daily Load (TMDL) or "pollution diet" defining how much nitrogen, phosphorus, and sediment each state could sent to the Chesapeake Bay.
Each state in the watershed and the District of Columbia then prepared Watershed Implementation Plans to document how they will comply with the TMDL. According to EPA's timeline, action plans had to be completed by 2025, and the bay should be restored by 2040.
The Chesapeake Bay can be saved, but not if the stressors continue to increase - and as population increases, stressors will increase. There is no mechanism in the American political system to limit population growth in the watershed, so reducing the stressors is not a realistic option.
Restoring the bay by the year 2040 will be expensive, and changing behavior of people living in the watershed so they generate less pollution per capita will not be easy. Still, implementing the practices and projects proposed in the WIP's triggered by the TMDL should capture enough pollution before it reaches the tributaries of the bay, so maximum daily limits are not exceeded and the bay can be "saved."
The cost to Save the Bay were estimated in 2004 by the Chesapeake Bay Watershed Blue Ribbon Finance Panel to be $6 billion annually. In 2014, the benefits were estimated by the Chesapeake Bay Foundation to be $22 billion annually.
Though both numbers are less-than-solid, the basic argument made by advocates for cleaner water is that the costs of restoring the Chesapeake Bay clearly are justified by the increased benefits, and it would be a wise investment to reduce sediment, nitrogen, and phosphorus levels so the bay and its tributaries met Clean Water Act standards.10
A fourth Chesapeake Bay Agreement, still including a signature for the Chesapeake Bay Commission, was signed on June 16, 2014. It was more specific than the previous agreements signed in 1983, 1987, and 2000 - and for the first time, included the headwaters states of Delaware, New York, and West Virginia.
For each of 10 goals, the 2014 Chesapeake Bay Agreement identified 31 specific outcomes and deadlines for reducing pollution and restoring the bay's ecological health by 2025. Multiple websites, including Chesapeake Progress, Chesapeake Decisions, and Chesapeake Stat, enabled the general public to track progress and recognize when deadlines were being met or would be missed.11
There is opposition to the Total Maximum Daily Load (TMDL) effort. The Farm Bureau and the National Home Builders Association have led efforts in the courts to block EPA's mandates. In 2016, the US Supreme Court upheld EPA's authority to establish the Total Maximum Daily Load (TMDL) and to force state compliance.12
There were two alternatives to the TMDL that would cost less and reduce requirements on farmers and developers:
- change the Clean Water Act, so the definition of saved is easier to meet (the "move the goalposts" approach)
- "lose" rather than "save" the bay, and live with a degraded, lower-quality estuary
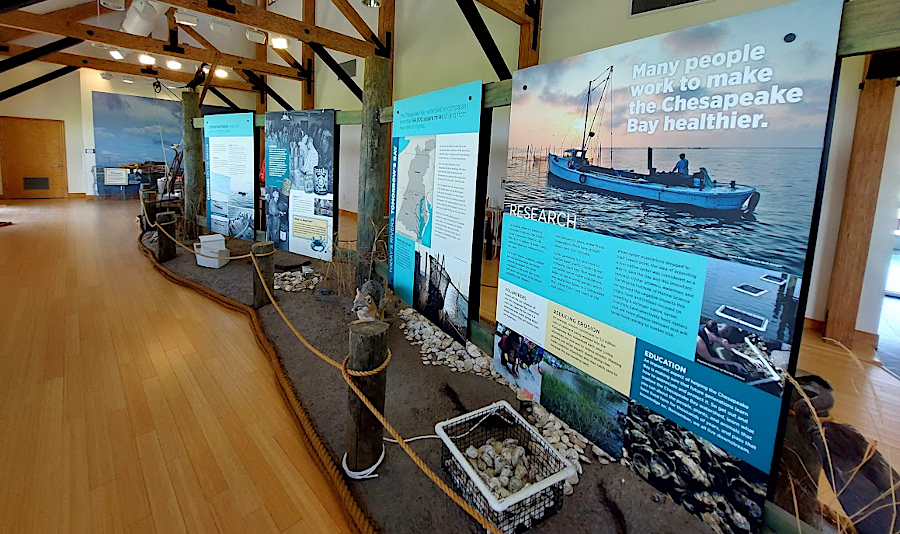
a Belle Isle State Park visitor center exhibit highlights the challenge of saving the bay
After election of Donald Trump in 2016, those choices became realistic. Efforts to eliminate/minimize the bay cleanup efforts shifted from the courts to the Congress.
In its 2020 budget, the Trump Administration proposed reducing funding for the Chesapeake Bay Program by 90%. The US Congress rejected a proposal in the 2018 budget to eliminate the program, and also rejected the proposal in the 2019 budget for a 90% reductions.13
The Virginia Department of Environmental Quality submitted a final version of Watershed Implementation Plan Phase III to the Environmental Protection Agency on August 19, 2019.14
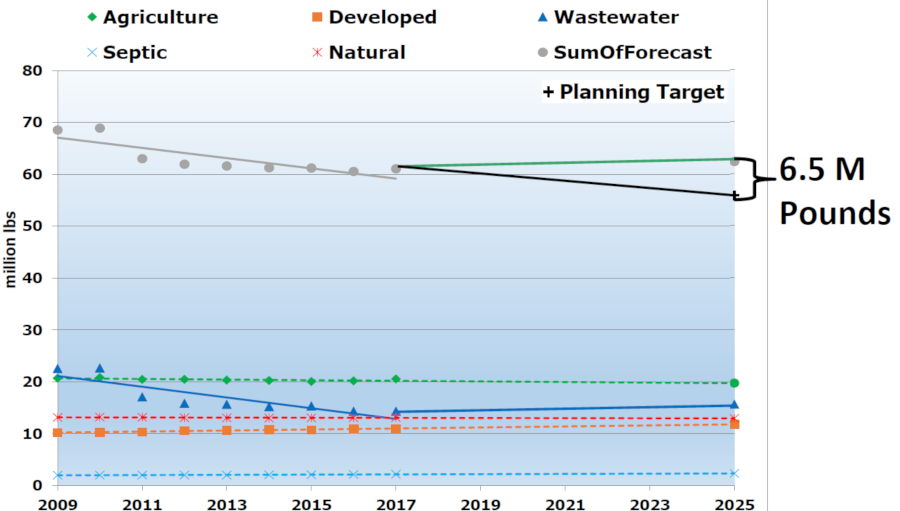
completion of Phase III required Virginia to reduce nitrogen loads by another 6.5 million pounds/year no later than December 31, 2025
Source: Virginia Department of Environmental Quality (DEQ), Chesapeake Bay Phase III Watershed Improvement Plan Update
The Biden Administration increased funding for the bay. One impact of global warming was documented in 2021 - the temperature of the Chesapeake Bay was increasing nearly twice as fast as global surface ocean water temperatures. The increase was greatest in the higher salinity areas of the lower bay. Water flowing into the bay from the Outer Continental Shelf was warmer as was stormwater runoff from urban areas, but 90% of the temperature increase was due to a warmer atmosphere transferring its heat to the water. The bay began to experience heat waves, when temperatures climbed significantly above historical averages for five or more consecutive days.
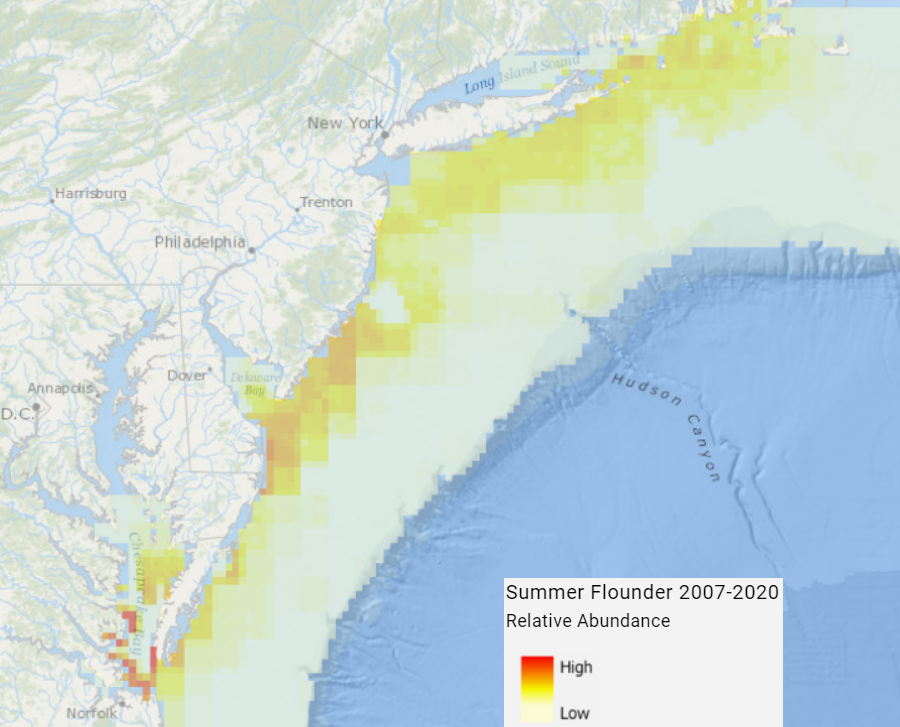
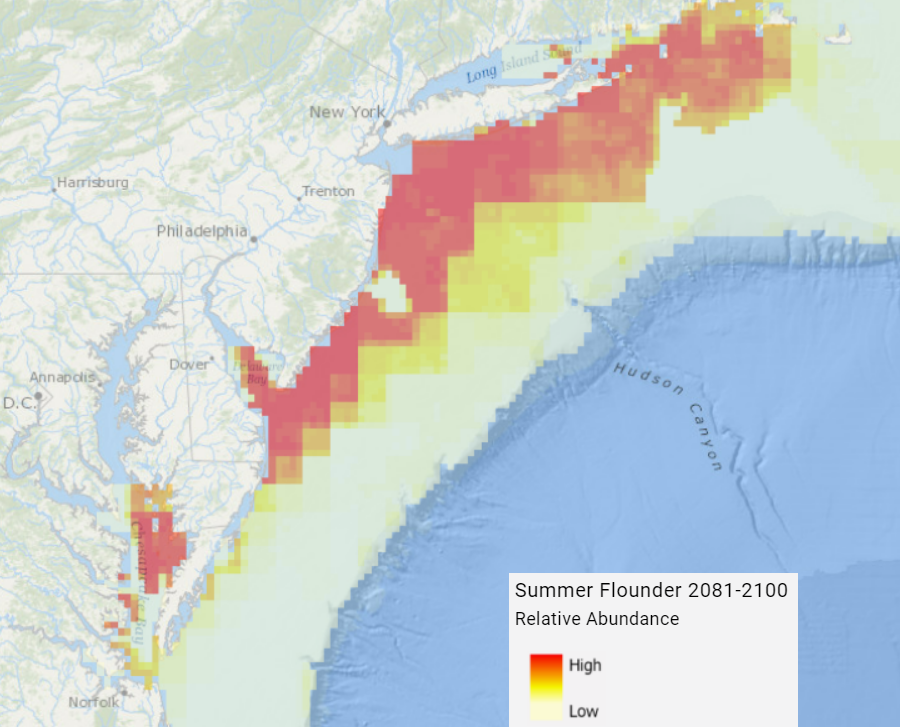
Warmer waters would attract some species such as shrimp, but make habitat less inviting for striped bass and summer flounder. Restoration of eelgrass in high-salinity areas was predicted to become more difficult as water temperatures rose. Lower levels of dissolved oxygen limited the impact of successful efforts to reduce excessive nutrients flowing into the Chesapeake Bay.
summer flounder populations will move north, as the Chesapeake Bay and Atlantic Ocean get warmer
Source: Mid-Atlantic Governors’ Agreement on Ocean Conservation (MARCO), Mid-Atlantic Ocean Data Portal
Since the late 1980's, the bay had warmed by 1.3°F, and:15
...showed a pronounced seasonal impact. Summer surface temperatures have increased by about 2 degrees, while winter water temperatures have risen by only about 0.6 degrees.
The Environmental Protection Agency relied upon computer models to assess the predicted impacts of different policies and projects intended to improve the health of the Chesapeake Bay. The primary components of the Chesapeake Community Modeling Program were models of the watershed, estuary, airshed, and land change, plus a "scenario builder" to create simulations of the past, present or future state of the Chesapeake Bay.
The Virginia Institute of Marine Science (VIMS) was chosen in 2022 to create Semi-implicit Cross-scale Hydroscience Integrated System Model (SCHISM), a new computer model for use starting in 2025. The Office of Water Prediction at the National Oceanic and Atmospheric Administration also adopted the model. SCHISM was programmed to offer 1-meter resolution, upgrading the capacity to assess impacts from climate change and revisions in water quality standards. The increased heat of the bay's water was expected to require even greater reductions in the flow of nutrients into the Chesapeake Bay.16
bacteria consuming nitrates at wastewater treatment plant
The accuracy of computer modeling was disputed in 2022, when the model was updated. The results indicated that less phosphorus was flowing to the Chesapeake Bay than earlier modelling had indicated.
However, the amount of nitrogen going into the bay was changed to a significantly higher number. The TMDL required elimination of 71 million pounds of nitrogen, but only 1/3 of that had been accomplished. The reduction came primarily from upgrading wastewater treatment plants, and those projects were almost complete.
Urban stormwater was delivering more nitrogen than previously estimated. Improvements in managing that stormwater were still possible, but the main source remaining for nitrogen was agriculture. Cover crops, stream buffers, manure storage facilities and other conservation practices on farms were offset by an increase in crop production, livestock, and fertilizer use. To come even close to the 2025 target for nitrogen, more controls on agricultural runoff would be required.
A 2021 report by the US Geological Survey suggested:17
If further reductions in nitrogen inputs are needed to reach nitrogen export targets, additional conservation measures will be important such as
(1) further decreases in application rates of fertilizer,
(2) continued efforts, increased efficiencies, and proper placement of agricultural best management practices,
(3) increased areas of cropland moved to conservation programs or otherwise land retired from production,
(4) development of new technologies that decrease the export of nitrogen from fields,
(5) decreased numbers of animals, and
(6) the development and implementation of technologies to remove nitrogen from manure before field application.
In 2019, the Chesapeake Bay Foundation evaluated Virginia's Watershed Implementation Plan (WIP) - Phase 3. It identified action steps to cut remaining nitrogen flowing into the bay by nearly 17%, and to reduce phosphorus by 15%.
The Chesapeake Bay Foundation concluded that the state was on track to achieve the 2025 pollution reduction goals. That assessment was contingent upon the General Assembly funding the remaining action steps in the plan in order to agricultural pollution and stormwater runoff from urban and suburban development.
Almost all wastewater treatment plants had already met their targets. The Water Quality Improvement Fund (WQIF) created in 1997 had funded $1 billion in grants for 100 projects to upgrade publicly-owned wastewater treatment plants in the Bay watershed. A nutrient credit trading system created in 2005 facilitated upgrades by the limited number of wastewater engineers and construction firms at larger facilities first. Smaller treatment plants met the nitrogen and phosphorus technology-based effluent limits by trading for credits until they could contract for later improvements.
By 2023, the improvements at wastewater treatment plants were responsible for 97% of Virginia's nitrogen reductions and 75% of the state's phosphorus reductions.
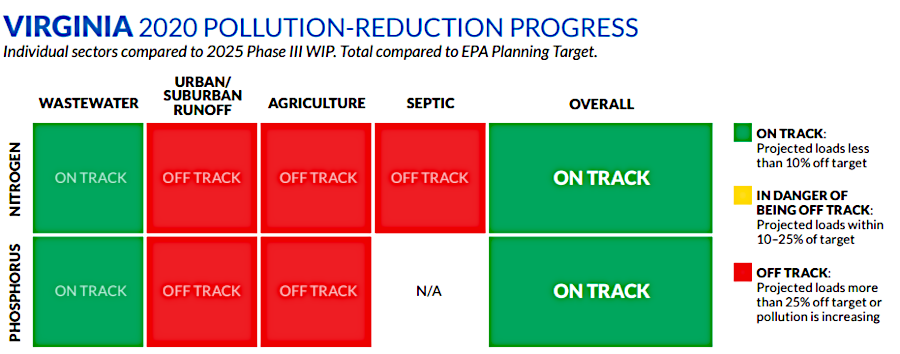
in 2021, the agriculture and stormwater sectors had fallen behind in meeting targets to cut nitrogen and phosphorus pollution
Source: Chesapeake Bay Foundation, 2021 Chesapeake Bay State of the Blueprint
Prior to adoption of the budget in 2022, the Chesapeake Bay Foundation continued to suggest the state was still on track. About 70% of the remaining pollution reductions would have to address agricultural pollution, with funding for farmers from the Conservation Reserve Enhancement Program and the Virginia Agricultural Cost-Share Program. Land use changes that modified 50,000 acres of forest and non-urban tree canopy annually led to pollution increases from urban and suburban sources, offsetting the reductions occurring in the agricultural sector.
Governor Youngkin said in September, 2022 that he expected Virginia to miss the target. He said they were set too high and the deadlines were too short, but that his administration would be more successful in reducing pollution from the agricultural sector:18
I put an emphasis on the agricultural side of things, best management practices is one that can have the largest effect on downstream and there was not a great level of trust in the previous administration in the ag community... I think we're going to need more time... I'm just cautioning everybody that if we come up short, don’t be surprised... It's not going to be from a lack of effort and lack of desire.
The Environmental Protection Agency and environmental groups such as the Chesapeake Bay Foundation acknowledged in late 2022 that the target date for implementing all the action strategies in Watershed Implementation Plan (WIP) III and meeting nutrient reduction goals would not be accomplished by 2025. About 90% of the remaining reductions needed to come from the agriculture sector, especially in Pennsylvania.
Recalibrating the timeline was required because only the District of Columbia and West Virginia had met the nutrient reduction goals for the 2020–21 milestone period. The jurisdictions in the Chesapeake Bay watershed had achieved a reduction of 30.3 million-pound reduction of nitrogen per year, but the target was 71.8 million pounds per year.
A recalculation of the "pollution diet" target of 71.8 million pounds of nitrogen per year in the computer model was also required. More actions would be required to reduce an additional 16 million pounds per year:19
- 6 million pounds of nitrogen per year because the reservoir behind the Conowingo Dam had filled and nutrients were no longer being trapped there
- 5 million pounds of nitrogen per year to offset the impacts of more-severe storms due to climate change, washing more nutrients into streams
- 5 million pounds of nitrogen per year to offset the impacts of population growth, increased fertilizer sales, and increased numbers of farm livestock in the watershed
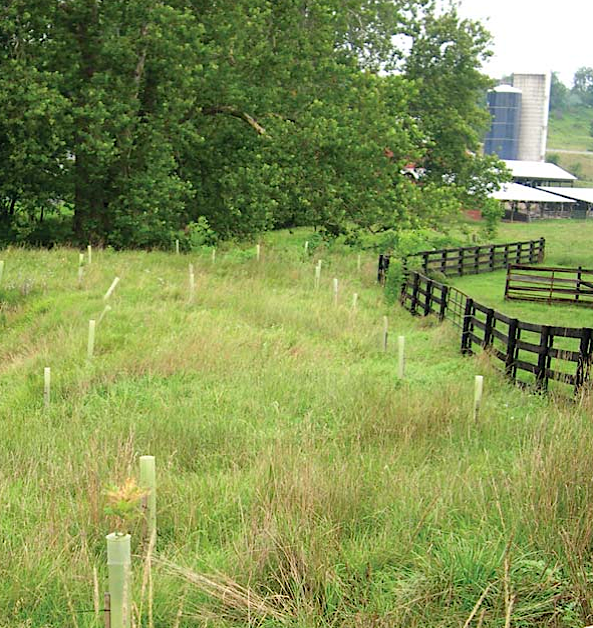
Admitting the 2025 date was a "deadline" but not a "finish line," the Virginia General Assembly extended the deadline for farmers to implement voluntary practices to fence cattle out of streams and protect buffer zones. Those practices were scheduled to become mandatory if Virginia failed to implement enough of them to meet its nutrient reduction targets from the agriculture sector. The deadline was extended from 2026 to 2028, and significant additional funding was committed by Virginia.
in 2023, the General Assembly extended the deadline for voluntary streamside fencing from 2026 to 2028
Source: Virginia Department of Conservation and Recreation (DCR), Streamside Livestock Exclusion (Figure 5)
Frustration over Pennsylvania's failure to implement its Watershed Implementation Plan led to Maryland and Virginia filing a lawsuit against the Environmental Protection Agency. The two states sought to force the Federal agency to implement "backstops" in Pennsylvania, the specific actions required if Bay states failed to meet their Watershed Implementation Plan commitments. The suit was settled in 2023 after the Environmental Protection Agency agreed to increase its compliance efforts, in part by additional attention to municipal separate storm sewer system ("MS4") and National Pollutant Discharge Elimination System (NPDES) permits in Pennsylvania.20
Pennsylvania has no frontage on the Chesapeake Bay, so saving the Bay did not resonate with Pennsylvania officials. Penny Gross, a Fairfax County supervisor who served on the Chesapeake Bay Local Government Advisory Committee for two decades, described in 2023 how she had engaged with a member of the US House of Representatives in 2006. That member suggested the Chesapeake Bay was irrelevant to his district, which was at the northern edge of the watershed:21
...a member of Congress from upstate New York said to me, "What does Chesapeake Bay mean to people in the Chemung River Valley where I represent?" And I said, "Congressman, it may not mean a lot. The Chesapeake Bay may not mean a lot to them, but the Chemung River does mean a lot to them." And so we really changed the discussion to bring it down to your local streams because if you can really focus on your local streams, then the Bay is going to get better.
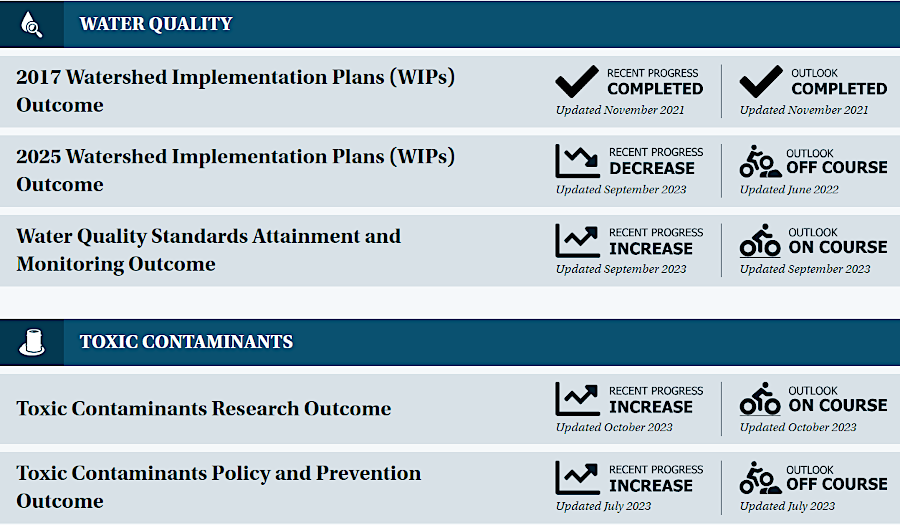
The 2023 Bay Barometer included an update on progress towards achieving 18 of the 31 defined outcomes identified in the Chesapeake Bay Watershed Agreement in 2014. The Chesapeake Progress report in January, 2024 identified 2 outcomes that were "completed," 16 outcomes that were "on course" towards completion, 3 outcomes that were "uncertain," and 10 outcomes that were off-course.
At the direction of the Chesapeake Executive Council, a Principals' Staff Committee produced "Charting a Course to 2025" with almost 200 recommendations to accelerate progress through 2025.22
Government and non-government organizations had recognized in 2022 that efforts would fall short of meeting the 2025 goals established in the 2014 Chesapeake Bay Watershed agreement. Only West Virginia was meeting its Total Maximum Daily Load (TMDL) targets.
Agricultural runoff from farms in Pennsylvania remained the largest source of nitrogen, phosphorus, and sediment. In 2015, the Environmental Protection Agency withheld Federal grants until the state took corrective action. However, the Federal agency declined to use its authority under the Clean Water Act to reject stormwater permits that state agencies were approving.
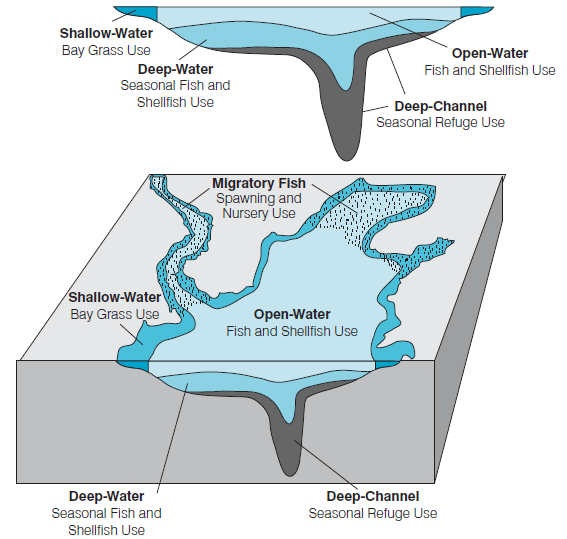
The Chesapeake Bay Program created a Beyond 2025 Steering Committee to define new objectives and strategies. Conservation organizations expressed concerns that proposals to focus reducing pollution in shallow water areas rather than deep channels would end up just "moving the goalposts" and avoid the tough/expensive policy decisions required to restore water quality in the entire bay.
The former vice president for litigation at the nonprofit Chesapeake Bay Foundation shared that perspective:23
If you work to address deep channel anoxia and hypoxia, you will see reductions in shallow areas... It's fine if you want to give credit for implementation practices that help shallow waters, but do not give up on deep channel goals. They drive everything.
The Chesapeake Bay Foundation concluded, based on the 2023 Comprehensive Evaluation of System Response (CESR) report by the Chesapeake Bay Program:24
As of 2023, based on modeled pollution reductions from restoration actions to date, the partnership is estimated to meet 57 percent of the goal to reduce nitrogen, 67 percent of the goal to reduce phosphorus, and 100 percent of the goal to reduce sediment. While this is significant progress, it remains far off track from the needed reductions. The partnership will collectively miss the 2025 goals by a wide margin.
in 2024, one year before the 2025 goal, progress towards 10 of the 31 outcomes was "off course"
Source: Chesapeake Progress, Outcome Status Summary (as of February 4, 2024)
The Chesapeake Bay Foundation identified two reasons for the failure to meet multiple targets, plus the increasing pollution flowing into the bay as the population in the watershed increased:25
... an "implementation gap" and a "response gap" in efforts to date. The first means the partnership has not yet implemented enough restoration practices at a large enough scale. The second means that even where practices have been implemented, water quality is not always improving as much or as quickly as expected.
To define needed actions to finish the job of cleaning up the Chesapeake Bay, a Steering Committee of the Chesapeake Bay Program published A Critical Path Forward for the Chesapeake Bay Program Beyond 2025 on October 24, 2024. The Chesapeake Executive Council met on December 10, 2014 and agreed to revise the Watershed Agreement in 2025. The executive direction was to consolidate the remaining objectives and streamline the coordination processes among all the partners, in order to continue making progress toward the goals. The Executive Council also created a a new Agricultural Advisory Committee. since so many failed targets were associated with agricultural runoff.
Virginia's Governor, Glenn Youngkin, could have taken the opportunity to limit his state's commitment to Save the Bay. His fellow Republican, Donald Trump, would take office in the following month as President of the United States. Together, they could declare that the Environmental Protection Agency's enforcement of the Clean Water Act should be constrained, and that the investment made to date was adequate so Federal funding for more cleanup action would be excessive.26
The FY2027 budget proposed at the start of the second Trump Administration did not reduce the $92 million for the Chesapeake Bay Program, but did propose major cuts to related programs in the Department of the Interior, Department of Commerce, and Environmental Protection Agency. Gov. Youngkin declared at the Chesapeake Executive Council meeting:27
As we look beyond 2025, Virginia remains fully committed to our Chesapeake Bay efforts and the future of this partnership, but we must see a focus on policies and principles that embrace effective government, accountability and prioritization of funding, and voluntary, incentive-based approaches that work with our farmers, and not against them.
On December 2, 2025, the governors of Virginia, Maryland, Pennsylvania, Delaware, New York, and West Virginia, the mayor of Washington DC, and representatives of the Chesapeake Bay Commission and the Federal government signed a new 2025 Chesapeake Watershed Agreement. The original Total Maximum Daily Load targets were not revised, but the target date was adjusted to 2040. In recognition of the priorities of the Trump Administration, climate resiliency initiatives were incorporated but the word "climate" was never used in the 23-page document.
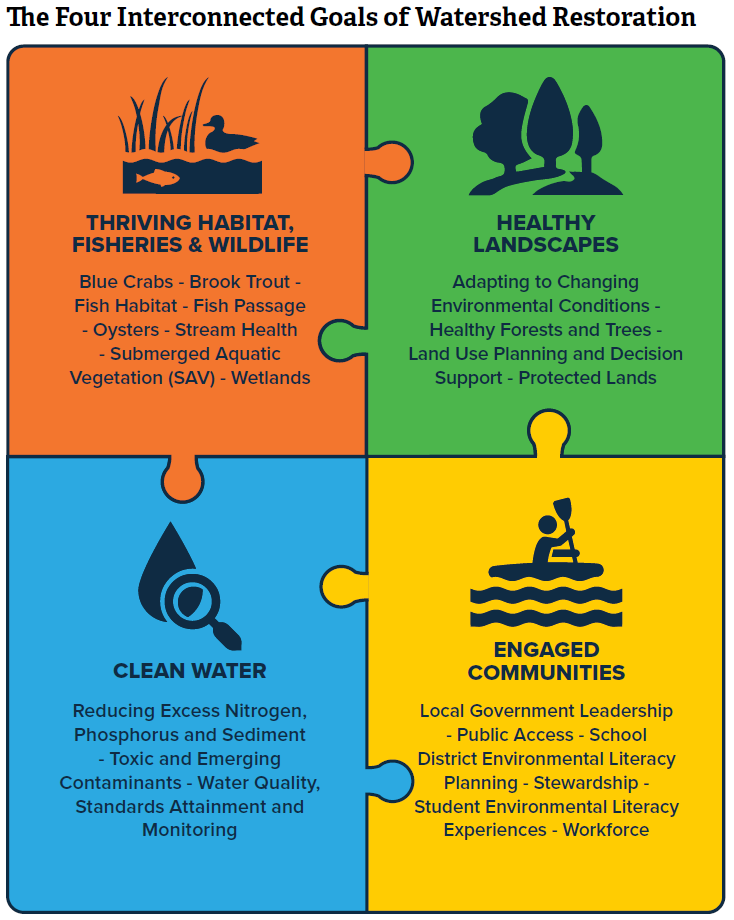
The new agreement established a 15-year target to meet 21 objectives, based on four goals. Those replaced the 31 outcomes and ten goals established in 2014. As in the previous agreement, intermediate checkpoints were identified to measure progress towards achievement.
By then, Virginia had met just one of three of its Total Maximum Daily Load targets. The state had achieved 100% of the necessary sediment reduction, but only half of the nitrogen reduction and 2/3 of the phosphorus reduction. In 2025, Virginia was sending more phosphorous into the Chesapeake Bay than any other jurisdiction. The state was third in the contribution of nitrogen.
Actions in the new agreement required more policy changes and more funding, which required political decisions by leaders in six separate states and the District of Columbia. The 2025 document included:28
One of the most important lessons the partners have learned from the past four decades is that although watershed-wide partnerships can help to coordinate and catalyze progress, implementation is locally inspired and driven.
Advocates for achieving the pollution reduction targets in the Toal Maximum Daily Load (TMDL) were disappointed that the revised agreement did not make firm commitments to implementing measurable, science-based strategies. The new target date of 2040 was not accompanied by new funding or policies to get better resultts. One advocate said:29
...simply extending the deadline out 15 years after 38 years of trying stretches credibility.
the 2025 Chesapeake Watershed Agreement set targets for action over the next 15 years to achieve four goals
Source: Chesapeake Bay Program, Chesapeake Watershed Agreement (December 2, 2025)