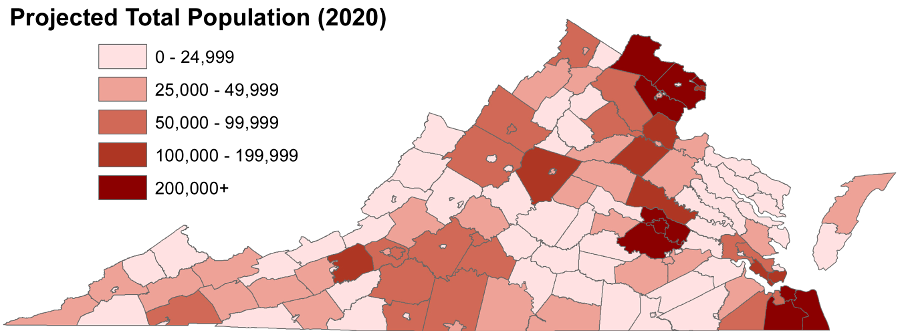
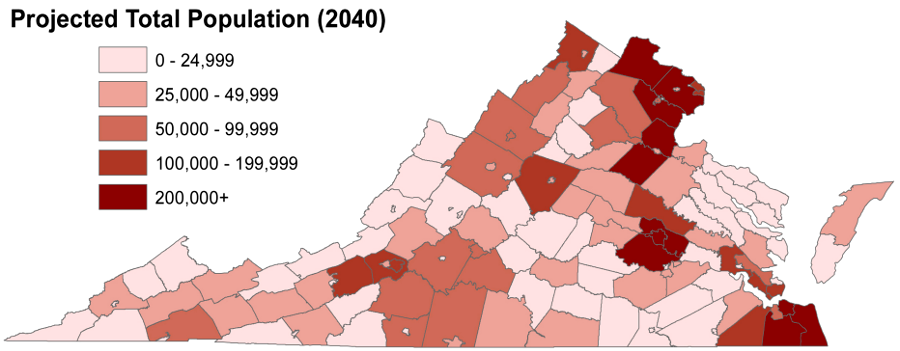
between 2020-2040, all of the Virginia jurisdictions with a population exceeding 200,000 are projected to be in the "urban crescent" from DC to Hampton Roads
Source: University of Virginia, Weldon Cooper Center, Demographics Interactive Map
Population centers in Virginia are not fixed and immutable, and some of the new urbanized areas (such as Tysons Corner and Reston in Fairfax County) are not even organized as cities/towns.
Some areas of high population density (especially Northern Virginia and Virginia Beach) are also the areas of high population growth, while some urban areas (Richmond, Petersburg, Norfolk, Roanoke) have been stable or lost population to the surrounding suburbs since Federal funding for highways spurred suburban development in the 1950's.
While Virginia was the state with the greatest population in 1790, urban development was slow to occur. Only once has a Virginia city made the list of the "top 10" of populated areas in the United States - in 1800, Norfolk was the tenth-largest city in the country.1
You can see the relative populations of Norfolk and Richmond are shown in the table below - obviously the capital of the state was not always the most populated area:
| 1790 |
|---|
| Richmond - #18 (national ranking in population by size)
Norfolk - #20 Petersburg - #21 Alexandria - #22 |
| 1800 | 1810 | 1820 | 1830 | 1840 | 1850 | 1860 | 1870 | 1880 | 1890 |
|---|---|---|---|---|---|---|---|---|---|
| Norfolk - #10
Richmond - #13 Petersburg - #30 |
Richmond - #12
Norfolk - #13 Petersburg - #25 |
Richmond - #12
Norfolk - #16 Petersburg - #28 |
Richmond - #13
Norfolk - #24 Petersburg - #30 Lynchburg - #59 Fredericksburg - #79 |
Richmond - #20
Petersburg - #34 Norfolk - #36 Wheeling - #51 Portsmouth - #62 Lynchburg - #65 |
Richmond - #26
Norfolk - #47 Petersburg - #50 Wheeling - #59 Portsmouth - #76 Lynchburg - #88 |
Richmond - #25
Petersburg - #50 Norfolk - #61 Wheeling - #63 |
Richmond - #24
Norfolk - #75 Petersburg - #77 |
Richmond - #25
Norfolk - #83 Petersburg - #89 |
Richmond - #35
Norfolk - #88 |
| 1900 | 1910 | 1920 | 1930 | 1940 | 1950 | 1960 | 1970 | 1980 | 1990 |
| Richmond - #46
Norfolk - #80 |
Richmond - #39
Norfolk - #82 |
Richmond - #38
Norfolk - #59 |
Richmond - #44
Norfolk - #62 |
Richmond - #45
Norfolk - #60 |
Richmond - #46
Norfolk - #48 Arlington - #68 |
Norfolk - #41
Richmond - #52 Arlington - #77 |
Norfolk - #47
Richmond - #57 Arlington - #77 Virginia Beach - #79 |
Norfolk - #55
Virginia Beach - #56 Richmond - #64 |
Virginia Beach - #37
Norfolk - #62 Richmond - #76 Arlington - #100 |
Three Virginia counties earned a place on a different "top 10" list at the start of the 21st Century. Between 2000-2005, Loudoun, King George, and Caroline counties were in the top 10 of the fastest growing counties in the country - based on the rate of population increase.
The growth of those counties reflected the continued expansion of the metro DC region to create "exurbs" to the west and south. As population growth continues, development of additional suburban housing subdivisions will transform those exurbs into "suburbs" and ultimately into the metropolitan urban core.
The population pattern shapes political campaigns for the five offices elected statewide - Governor, Lieutenant Governor, Attorney General, and two US Senators. Candidates must win votes from people, not acres. Maps that show votes by jurisdiction overstate the significance of rural areas with small populations, potentially leaving the impression that most of Virginia supported a candidate who lost the election.
In the 2018 election for US Senate, the Democratic candidate Tim Kaine easily won re-election over the Republican candidate Corey Stewart with 57% of the statewide vote. Corey Stewart won most of the jurisdictions, but in statewide elections winning a county, city, or town makes no difference. Senator Kaine won Fairfax County and Corey Stewart won Lee County, but the vote totals in the two counties were vastly different. In Fairfax County, Kaine got 340,354 votes. In Lee County, Stewart got 5,096 votes.
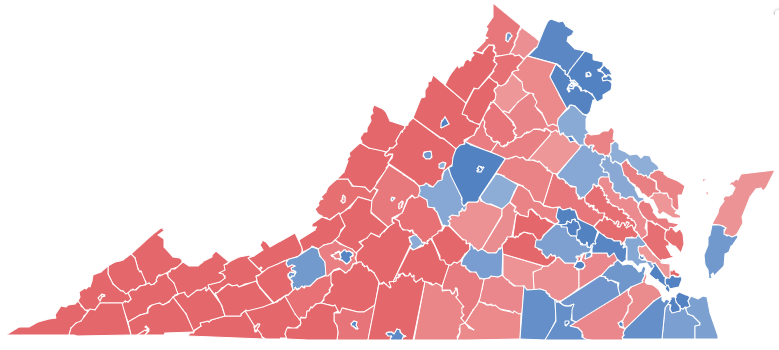
most Virginia jurisdictions voted for the Republican candidate for the US Senate in 2018
Source: Virginia Public Access Project, 2018 US Senate Election
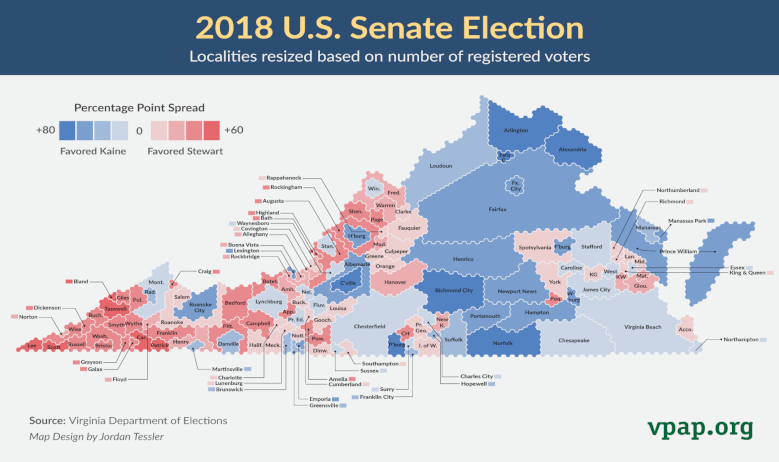
resizing the map to show votes by population rather than acreage reveals the significance of urban/suburban areas
Source: Virginia Public Access Project, 2018 US Senate Election
In 2000-2005, the population of Virginia increased 6.9%, up 488,435 people to 7,567,465 total population in the state. However, population growth was not consistent across the state - and 20 counties in Virginia (21% of the counties in the state, out of 95 total) actually lost population.
The Virginia counties with declining populations between 2000-2005 were far from the metro areas of Northern Virginia, Richmond, and Hampton Roads:
- Alleghany County (-2.9%)
- Bath County (-2.2%)
- Brunswick County (-2.7%)
- Buchanan County (-8.2%)
- Charlotte County (-0.5%)
- Dickenson County (-0.9%)
- Grayson County (-3.1%)
- Greensville County (-4.1%)
- Halifax County (-2.9%)
- Henry County (-2.6%)
- Highland County (-2.4%)
- Mathews County (-0.1%)
- Nottoway County (-1.0%)
- Patrick County (-1.0%)
- Pulaski County (-0.1%)
- Russell County (-1.1%)
- Scott County (-1.9%)
- Smyth County (-1.3%)
- Sussex County (-3.5%)
- Wise County (-0.5%)
total population growth/decline in Virginia 2000-2005
rate of population growth/decline in Virginia 2000-2005
Not everyone is migrating from the rural areas to the cities. More than 50% of the cities in Virginia (20 out of 39) also lost population between 2000-2005. The cities losing population were located all across the state, except in Northern Virginia:
- Bedford city (-2.9%)
- Bristol city (-0.2%)
- Covington city (-1.6%)
- Danville city (-4.7%)
- Emporia city (-1.4%)
- Galax city (-2.4%)
- Hampton city (-0.6%)
- Lexington city (-1.3%)
- Martinsville city (-2.9%)
- Newport News city (-0.4%)
- Norfolk city (-1.0%)
- Norton city (-6.2%)
- Petersburg city (-3.4%)
- Portsmouth city (-0.4%)
- Radford city (-8.1%)
- Richmond city (-2.1%)
- Roanoke city (-2.4%)
- Salem city (-0.4%)
- Staunton city (-2.2%)
- Williamsburg city (-2.1%)
total population growth/decline in United States, 2000-2005
rate of population growth/decline in United States, 2000-2005
Source: Bureau of Census, Cumulative Estimates of Population Change for the United States, States and Counties, and for Puerto Rico - April 1, 2000 to July 1, 2005
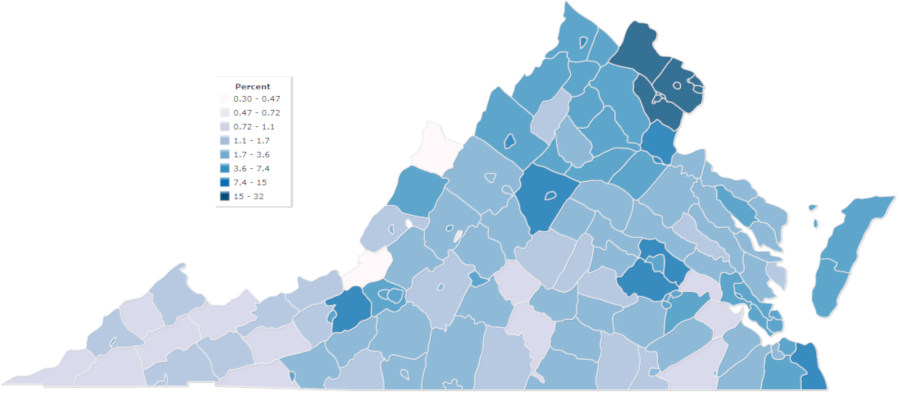
the percentage of foreign-born residents in Virginia is higher in urban areas
Source: IndexMundi, Virginia Foreign-Born Population Percentage by County (2009-2013)