August/September, 2016 streamflow
Source: US Geological Survey (USGS), Water Watch
August/September, 2016 streamflow
Source: US Geological Survey (USGS), Water Watch
The depth and width of stream channels in Virginia have been shaped by the normal flow of water, resulting from the normal runoff from an average year. However, rainfall in Virginia on any particular day or for any particular year is rarely "average." Averages (including the mean, median, and mode) come from recording rainfall for decades and then using statistics to derive a reliable pattern.
Across Virginia, the average rainfall is 43" per year. That statewide number varies by location, season, and year.
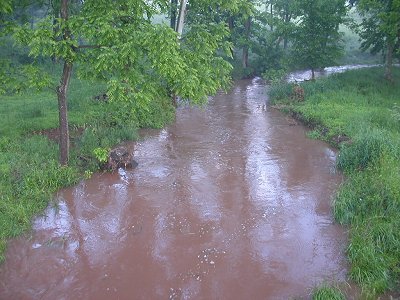 Young's Branch on Manassas National Battlefield Park at "bankfull" level, before rising higher and flooding adjacent fields (the "floodplain") in August, 2003 |
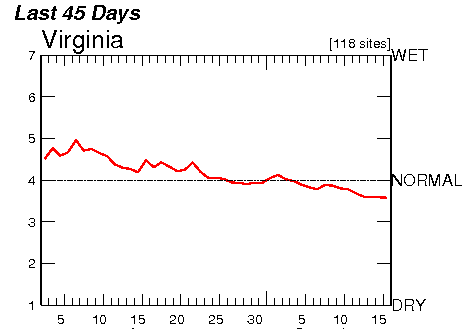
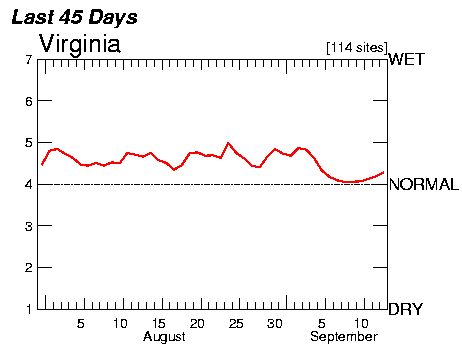
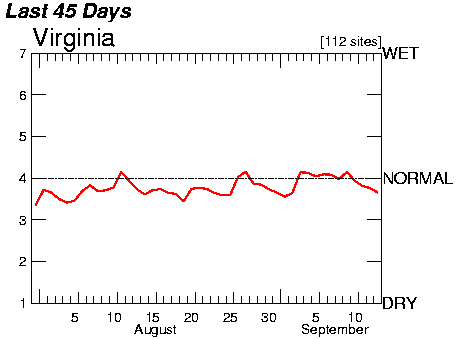
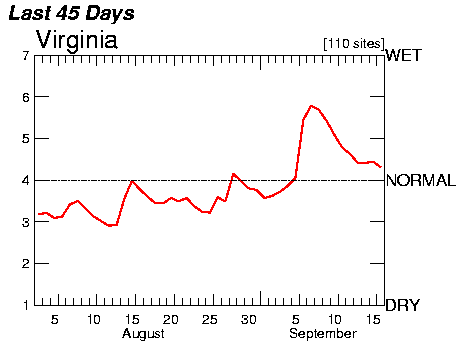
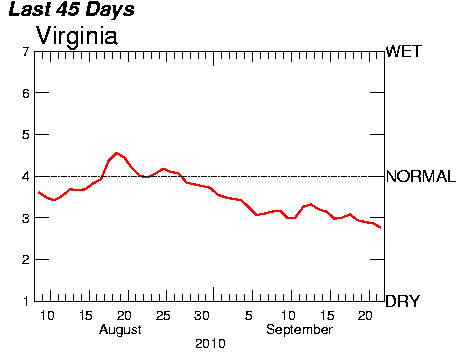
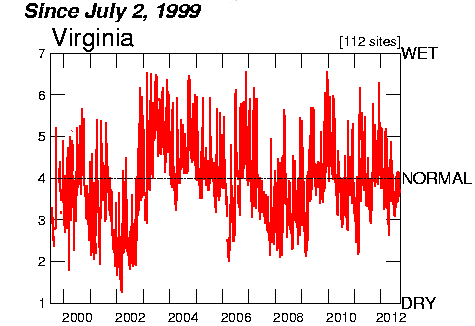 patterns of Virginia streamflow in mid-September, 1999-2012 |
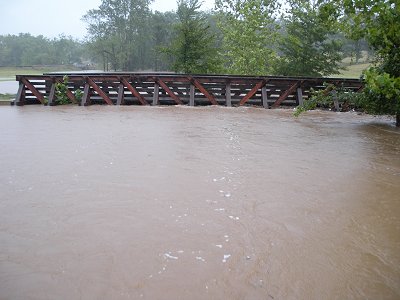 Youngs Branch on Manassas Battlefield (September 6, 2008) |
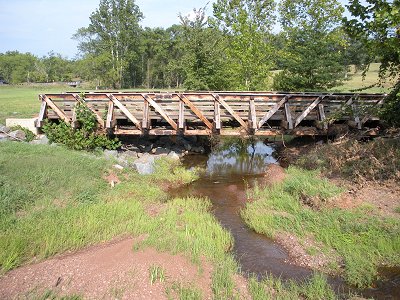 Youngs Branch one week later (September 13, 2008) |
A single year of drought is just a short-term problem. A string of drought years back-to-back can have substantial impact. Studies of tree rings, where the growth of bald cypress trees from southeastern Virginia can be measured back into the 1500's, suggest the English settlers landed at Jamestown during a severe drought. The saltiness of the water in the summertime at Jamestown peaked then, perhaps debilitating the colonists through subtle and slow salt poisoning.
The Roanoke Island colonists on the Outer Banks between 1584-87 also were unfortunate in their timing. A scientist examining bald cypress tree rings dating back to 1185 CE (Common Era) determined:1
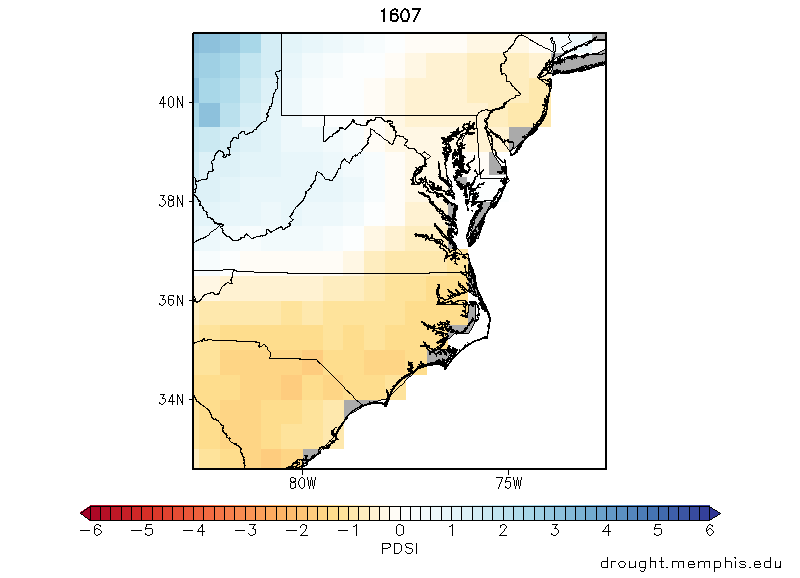
English colonists arrived at Jamestown during a record-setting drought, measured by the Palmer Drought Severity Index (PDSI)
Source: North American Drought Atlas
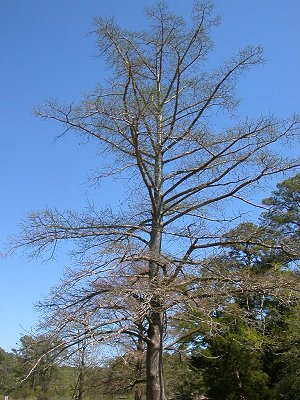
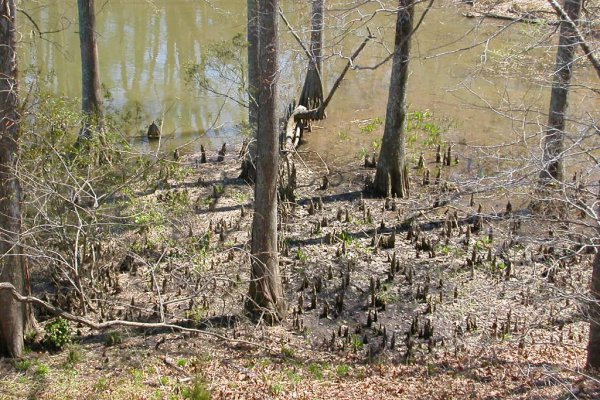
modern bald cypress tree at Jamestown and bald cypress knees at James Smith's Fort
The timing of low precipitation may be as important as the total shortfall. Ski operators care about precipitation in the winter. Every day of snow might incentivize urban residents to plan ski trips. The slopes in Virginia may be covered with manufactured snow most of the winter and not require natural precipitation, but weather reports about real snow stimulate people to consider ski trips.
Grape growers are sensitive to August/September rains. If harvest time is dry, juice in grapes is concentrated, the sugar percentage increases, and the winemaking is easier. If it rains just before harvest, grapes can absorb so much water that they may even split their skins. More skill is required to bring in the grapes and create a great wine from a wet harvest.
The intensity of rain and drought creates impacts on both gray and green infrastructure. Northern Virginia gets lots of rain in the summer from short, intense thunderstorms. Stormwater systems are designed to handle just a certain amount of water flow. Fast-falling rain can overwhelm the drainage system as well as natural stream channels and cause floods.
In the winter, lightning/thunder is rare and three days of gray, overcast skies are common. At the start of the Spring Semester after the holiday break, students at Virginia Tech in Blacksburg get tired of seeing gray skies above a campus filled with equally-gray limestone buildings.
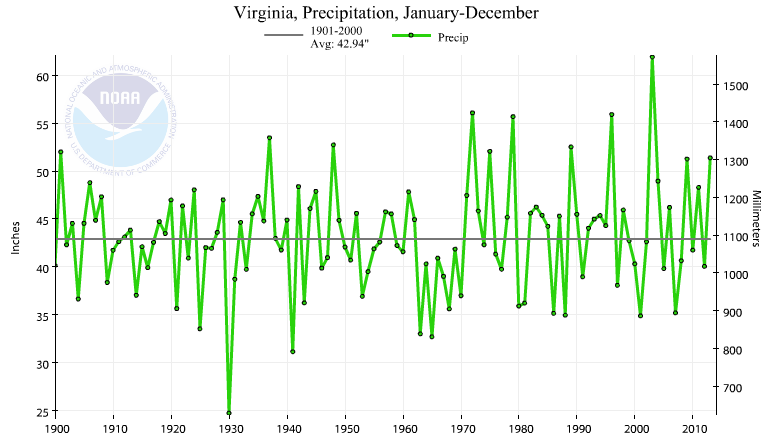
since 1900, rainfall in Virginia has ranged from 25 inches/year to over 60 inches ("average" is 43 inches/year)
Source: National Oceanic and Atmospheric Administration (NOAA) National Climatic Data Center, Climate at a Glance
A predicted impact of climate change, with increased energy in the atmosphere, is an increase in the intensity of weather events. Rainfall and snowfall will be heavier within short periods of time, triggering greater flooding and erosion.
More-intense storms will, over time, alter the shapes of natural floodplains and stream channels, as they accommodate new patterns of fast/heavy rainfall runoff. In the four decades after 1981, Virginia has experienced storms with more than 1" of precipitation for an additional day each year.2
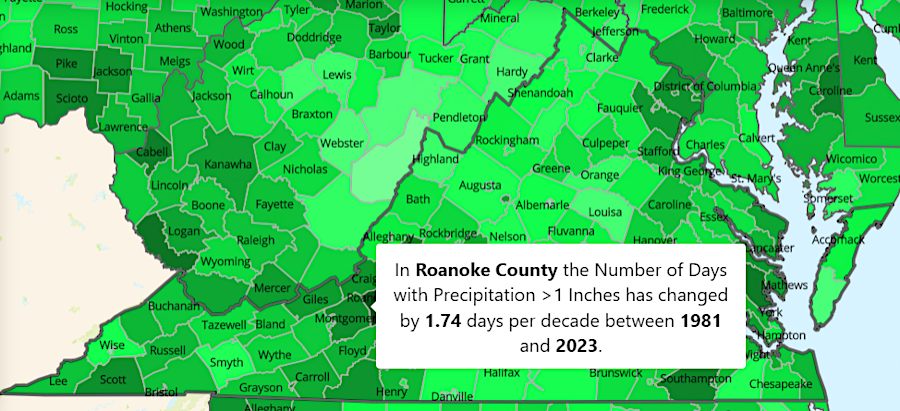
intense storms dropping at least 1" of rain in Virginia are increasing as the atmosphere warms
Source: Urban Sustainability Directors Network, Climate and Hazard Mitigation Planning (CHaMP) Tool
Droughts, in contrast to storms, evolve slowly. High-altitude air currents such as the Jet Stream move north in the summer. That allows high pressure systems to remain in place longer, sometimes blocking rainfall for weeks.
Rains in the Fall can recharge groundwater and renew streamflow. Hurricanes can generate enough rainfall in one day to refill reservoirs. The amount of water flowing in streams depends upon the timing of precipitation:
 average Virginia streamflow in mid-September, 2008 | |
 average Virginia streamflow in mid-September, 2007 |
 average Virginia streamflow in mid-September, 2004 |
 average Virginia streamflow in mid-September, 2003 |
 average Virginia streamflow in mid-September, 2002 |
Damage to human-built infrastructure by a drought is rare; roofs do not blow off and roads are not blocked. Television stations shift into continuous "the sky is falling" weather coverage during hurricanes and snowstorms, with brightly colored maps based on Doppler radar data to display precipitation totals. Droughts are less visual; commercial television programs are not interrupted with warning sounds to announce drought alerts.
The Virginia Drought Monitoring Task Force declares official droughts within one or more of 13 defined regions. A drought declaration can trigger calls for voluntary water conservation, and then mandatory measures when necessary. Declarations are based on four factors: precipitation, groundwater levels, streamflow, and reservoir levels.
Virginia has established three levels of action to deal with a drought. A drought "watch" may be declared when two of the four indicators reach a threshold below "normal." If water supply reservoirs drop below a 120-day supply of useable storage and streamflows fall between the 10th and 25th percentile, a "watch" may be declared.
A "warning" may be announced if water supply reservoirs drop to a 60-90-day supply and streamflows fall between the 5th and 10th percentile. A drought "emergency" may be triggered if water supply reservoirs drop to less than a 60-day supply and streamflows fall below the 5th percentile. Comparable thresholds are defined for consideration of precipitation and groundwater level indicators as well.3
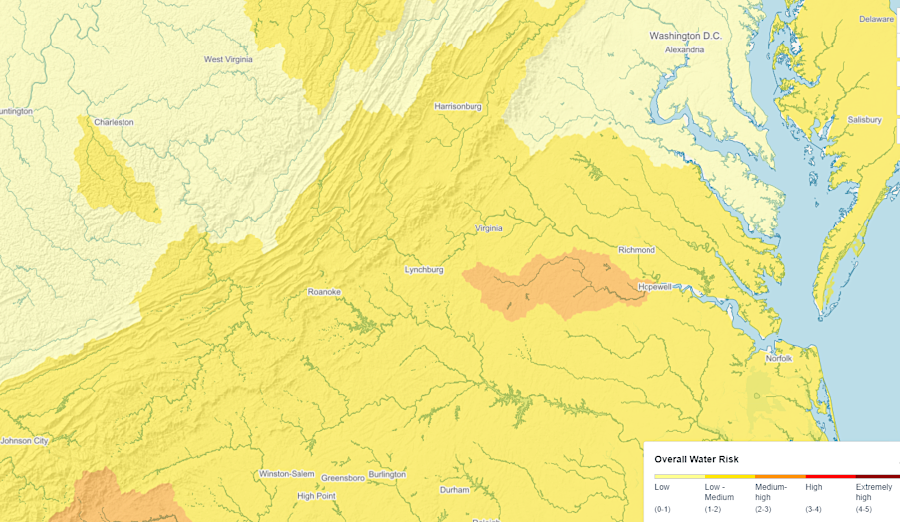
the Appomattox River basin is at a higher risk of water shortage than other watersheds
Source: Water Resources Institute, Water Risk Atlas
The Drought Coordination Committee of the Metropolitan Washington Council of Government (COG) declared a drought "watch" on July 26, 2024. That action was based on the COG Water Supply and Drought Awareness Response Plan. It was the first "watch" declaration since adoption of the Northern Virginia Regional Water Supply Plan in 2011. The designation triggered outreach efforts to encourage the six million residents in the Potomac River watershed near Washington, DC to implement voluntary water conservation practices.
The "watch" declaration did not trigger releases from the Jennings Randolph and Little Seneca Reservoirs upstream to augment the Potomac River flows; that water was saved in case the drought continued. The "emergency" declaration was reserved for when there would be a 50% chance that demand for water would exceed supply over next month.4
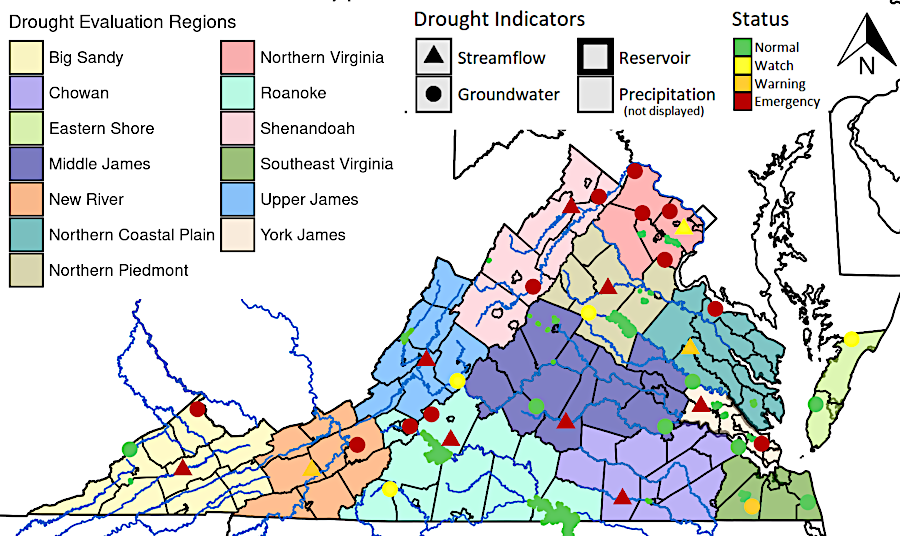
Drought Region Indicator Map on July 1, 2024
Source: Virginia Department of Environmental Quality (DEQ), Drought
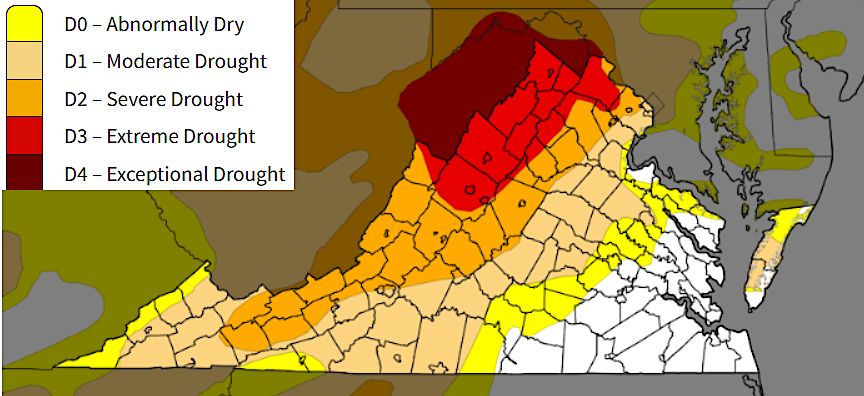
the Metropolitan Washington Council of Governments declared a drought warning for Northern Virginia in 2024
Source: National Integrated Drought Information System (NOAA), US Drought Monitor: Virginia (July 23, 2024)
The worst drought of the 20th Century in Virginia was in the 1930's, the same period of the Dust Bowl in Oklahoma. In 2002, Virginia experienced another record-setting drought that was followed in 2003 by record-setting rainfall.5
 in 2002, Virginia rivers were at record low flow levels (red dots) |
 in 2003, rivers were at above-average high flow levels (blue dots) |
Starting in 1997, the faucet ran dry and Virginia received below-average rainfall for five of the next six years. In 1999, the multi-year drought in southeastern Virginia was interrupted by major flooding from Hurricane Floyd, but the rest of the state continued to suffer.
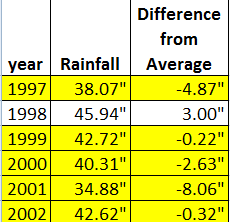 rainfall was below average statewide between 1997-2002 |
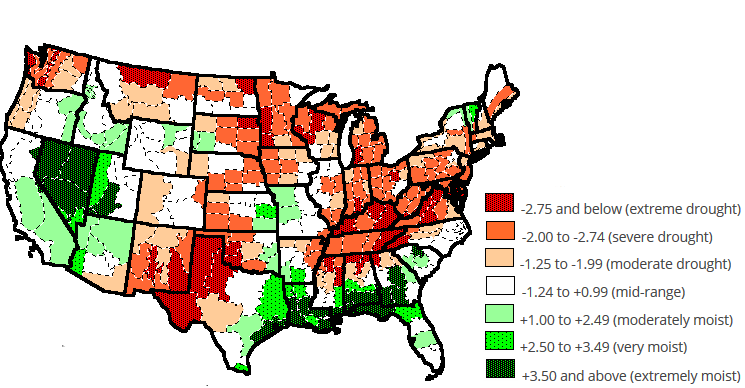 in September 1998, the Palmer Drought Index showed all of Virginia in moderate to extreme drought |
Source: National Oceanic and Atmospheric Administration (NOAA) National Climatic Data Center, Drought - Summer 1999 | |
Rapidan flows since the 1930's
Source: USGS National Water Information System (NWIS) -
USGS 01667500 RAPIDAN RIVER NEAR CULPEPER, VA
In the 1950's and again in the 1960's, droughts had lowered the flow of the Rapidan River below 10cfs. The Rapidan River went almost completely dry in 2002, with flow dropping down to 0.45 cubic foot per second (cfs).
The drought forced the water system in the Town of Orange into emergency status. All public restrooms were locked, and portajohns decorated the parking lots of even the fast food restaurants. The police chief captured condensation from the air conditioner in town hall in order to wash police cars. At home, his basement dehumidifier and bath water provided what he required to flush toilets.6
Rapida River record lows
Source: USGS Water Resources, USGS 01667500 RAPIDAN RIVER NEAR CULPEPER, VA
A cubic foot of water is close to the size of a basketball, about 7.5 gallons. When the Rapidan River flow dropped to one cubic foot of water per second (cfs), that means about 7.5 gallons per second were flowing past the river gauge on the Orange County-Culpeper County line.
If every drop of Rapidan River water were diverted to the water system, leaving nothing for the fish in the river and letting them die in the sun, then the Rapidan River flowing at 1cfs could supply only 450 gallons per minute (7.5 gallons per second x 60 seconds in a minute). A single house can use 5 gallons/minute, so the drought was a crisis.

Source: Drought Monitor - 2002
In 2003, rainfall in Virginia was above-average. In October, 2003, Hurricane Isabel showed that flooding is not the only problem with storms. Tree roots in Virginia's saturated soil could not withstand the long period of strong winds. Massive power outages occurred as trees fell on power lines that were not buried underground.
Storms named Gaston and Ivan made September 2004 far wetter than average and created dramatic flooding in some places. In 2011, the trigger for flooding and power outages was Tropical Storm Lee.
Droughts and floods are common experiences across Virginia. Land use planners and disaster management specialists pay close attention to development within the 100-year floodplain, the area where there is a 1% chance of a flood at any time, but the potential lack of water is equally serious.
Water distribution has two facets - how Mother Nature provides it, and how humans capture and distribute it. One is a science story, the other is political. Two droughts in 1998 and 2002 were sufficient for the General Assembly to require all localities to create a long-range plan to ensure an adequate water supply consistent with planned population growth.
After the 2002 drought, the General Assembly passed legislation requiring all counties/cities to prepare water supply plans, and to prepare to meet future demand. in 2003 the Drought Response Technical Advisory Committee delivered a Virginia Drought Assessment and Response Plan. It encouraged regional planning for water management, though local jurisdictions were allowed to create long-range plans if they chose not to partner with their neighbors.
Some communities proposed new sources of supply, while others emphasized conservation. Charlottesville debated for nearly a decade whether to raise the height of the Ragged Mountain dam and flood adjacent property vs. dredge the reservoir to increase its capacity. In the end, Charlottesville chose to increase supply by building a new dam that was 42' higher, rather than relying upon existing reservoirs and water conservation.
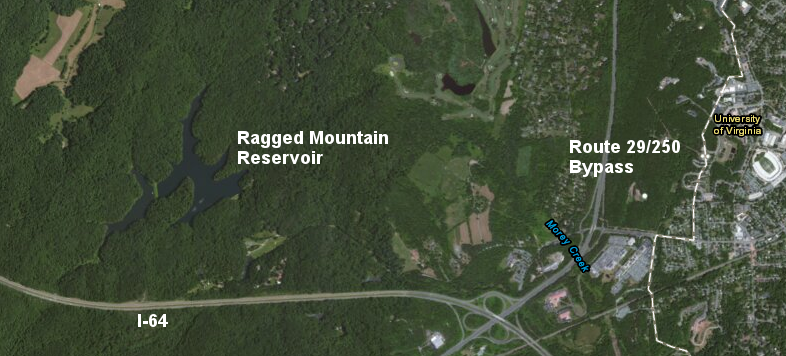
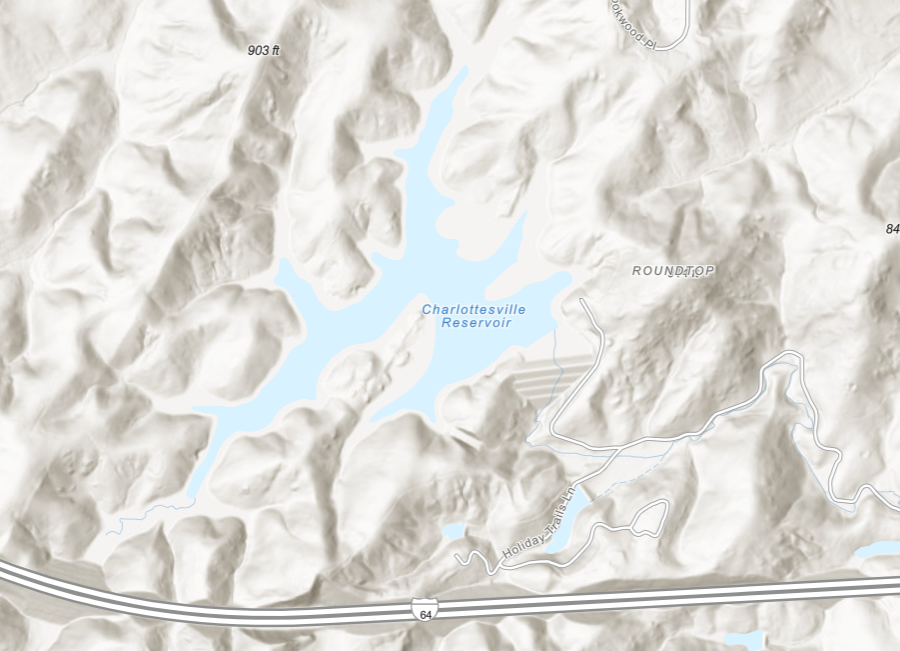
to ensure adequate water supply, the Rivanna Water and Sewer Authority chose to expand the Ragged Mountain Reservoir
Source: ESRI, ArcGIS Online
The Rivanna Water and Sewer Authority later invested in building a 6.5 mile, 36" pipeline to connect the South Fork Rivanna Reservoir to the Ragged Mountain Reservoir. The pipe was large enough to move 25 million gallons/day.7
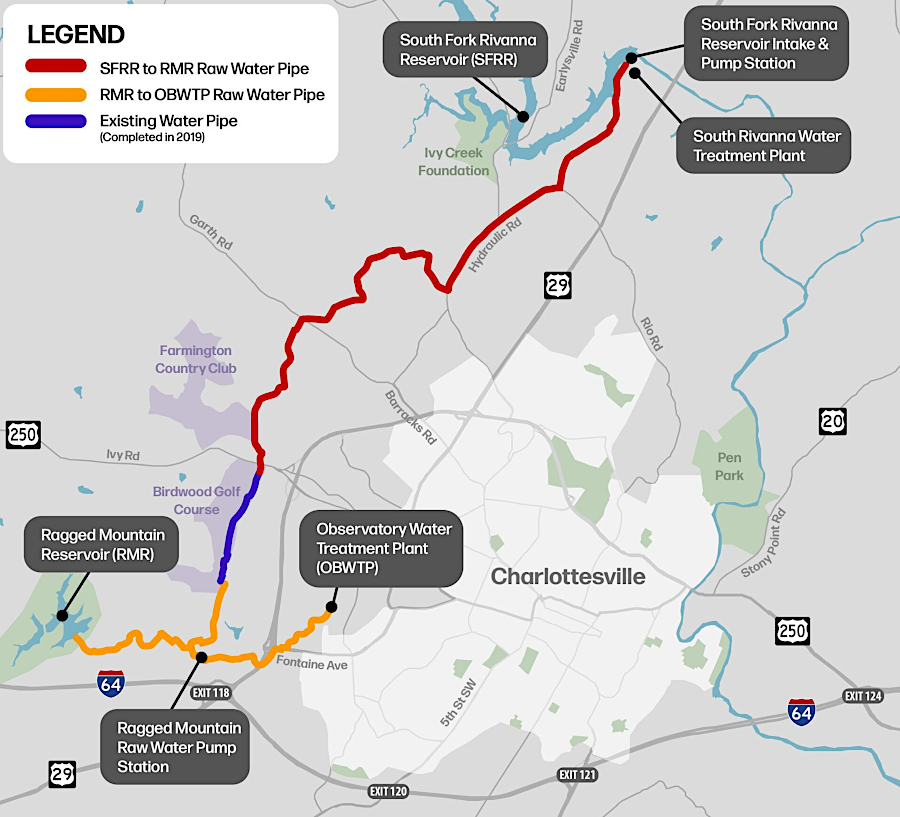
Charlottsville built a 6.5 mile pipeline in 2026 to connect the South Fork Rivanna Reservoir to the Ragged Mountain Reservoir
Source: City of Charlottesville, Raw Water Line Construction Advances (July 2, 2026)
In the Roanoke region, after the 2002 drought local officials revisited proposals for regional water planning. In the 1990's the City of Roanoke and the City of Salem had jointly planned to build a new Spring Hollow Reservoir with Roanoke County, then withdrew with concerns about the costs. The City of Roanoke had traditionally used its control over the drinking water supply in Carvins Cove Reservoir as a regional bargaining tool, and was reluctant to give up its political leverage. To the surprise of city officials, Roanoke County then funded all the costs and built the new reservoir.
In 2004, the city's leverage had been reduced and the drought forced reconsideration of regional water supply planning. After a new round of negotiations, the City of Roanoke and Roanoke County merged their utility departments to create the Western Virginia Water Authority. The City of Salem did not join; it built a separate drinking water treatment plant that tapped the Roanoke River. Franklin and Botetourt counties and the towns of Boones Mill and Vinton later became members of the Western Virginia Water Authority.
During the 2024 drought, the former administrator of Roanoke County expressed satisfaction at creating a regional system that provided greater reliability to the member jurisdictions:8
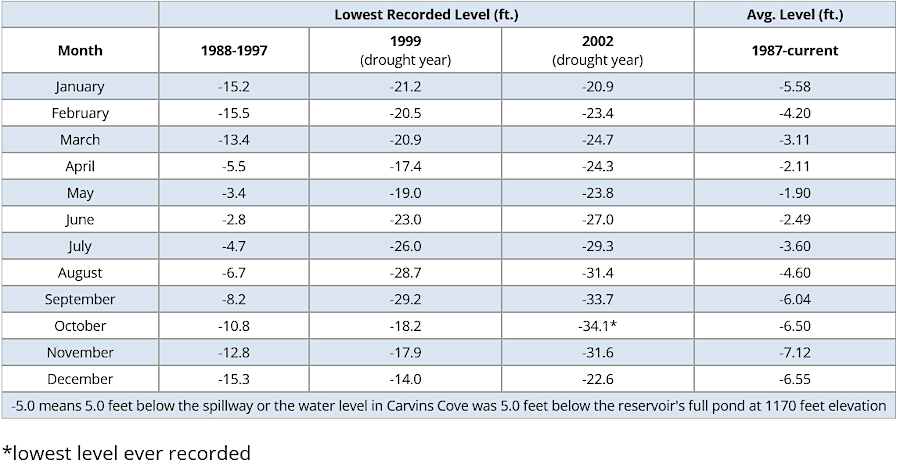
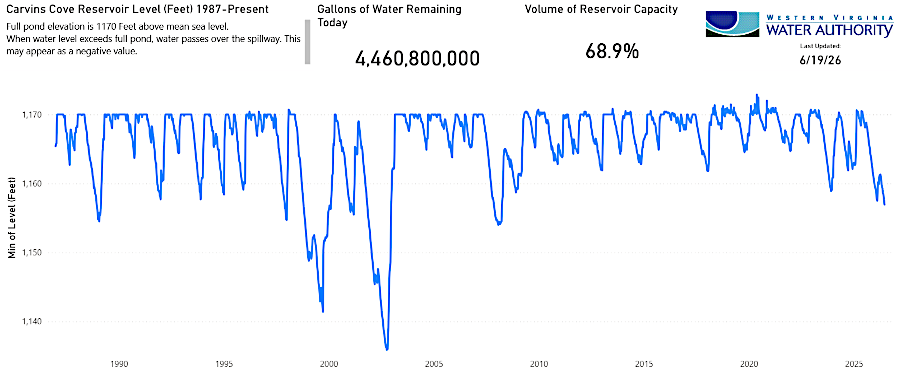
the lowest water level measured to date at Carvins Cove Reservoir occurred in October, 2002
Source: Western Virginia Water Authority, Historic Reservoir Levels; Reservoir Levels (June 22, 2026)
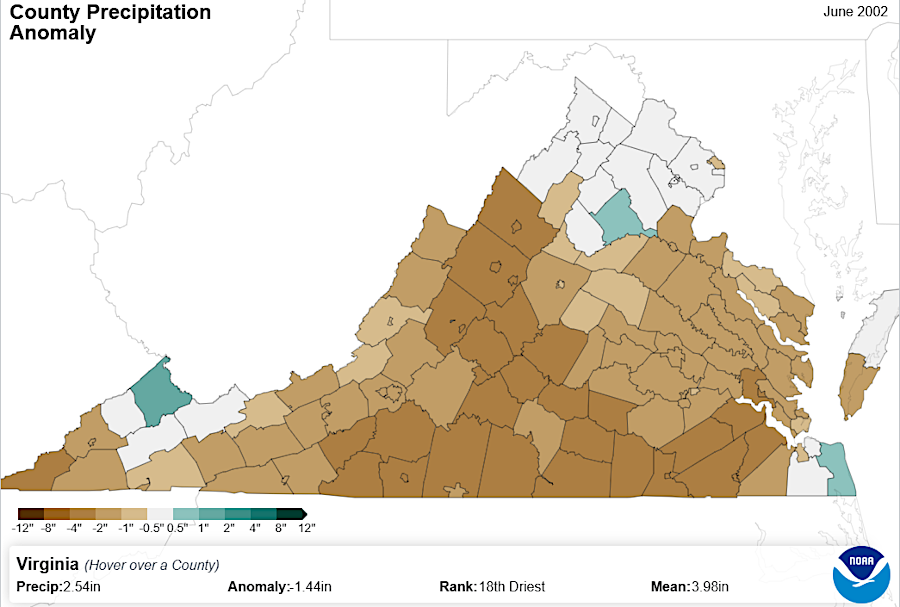
The National Integrated Drought Information System indicated the 2024 drought was the driest June for all of Virginia. Lack of rain in early June dramatically reduced grass growth in the Shenandoah Valley. Pastures had grass only 2" high in July, instead of 8-10" high grass for forage.
Ranchers were forced to use hay that they normally stockpiled for winter feeding, since cattle, sheep, and horses could not graze in the sun-baked pastures. Calves were weaned a month early. Sheep were sheared to keep them cooler, even though the short wool fibers would be worth only $0.10/pound.
After local counties declared a drought disaster, the U.S. Department of Agriculture authorized payments under the Livestock Forage Disaster Program so ranchers could purchase additional feed. Some ranchers chose to sell their livestock earlier than planned. One in Augusta County said:9
One man who took several cows to the auction at Harrisonburg ran into a crowd of like-thinking ranchers:10
drought reduced Shenandoah Valley forage enough in 2024 for the Federal government to authorize disaster relief payments
Source: US Department of Agriculture (USDA), Livestock Forage Program Native Pasture - 2024 Program Year
A drought starting in 2024 caused water managers to anticipate drawing down reservoirs on the Potomac River later in 2025. In normal summers the Interstate Commission on the Potomac River Basin estimates an 8-15% probability of having to call on reserves, including water stored upstream in West Virginia. For 2025 it calculated a 22-36% probability.11
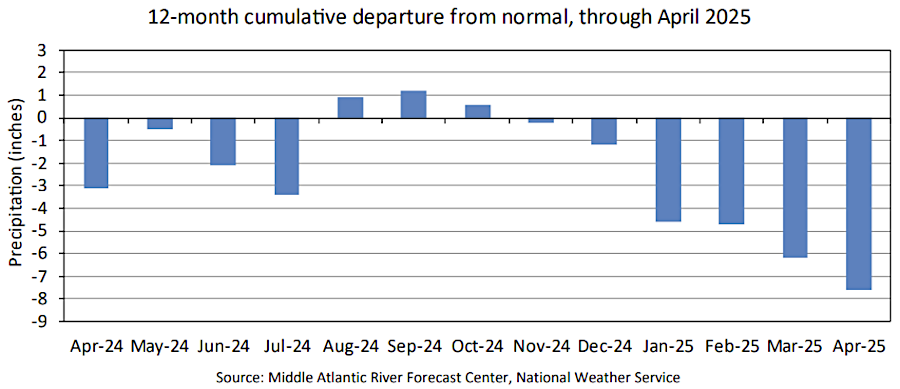
by May 2025, a year's worth of lower-than-average rainfall triggered concerns about Potomac River water supply
Source: Interstate Commission on the Potomac River Basin (ICPRB), Water Supply Outlook (May 1, 2025)
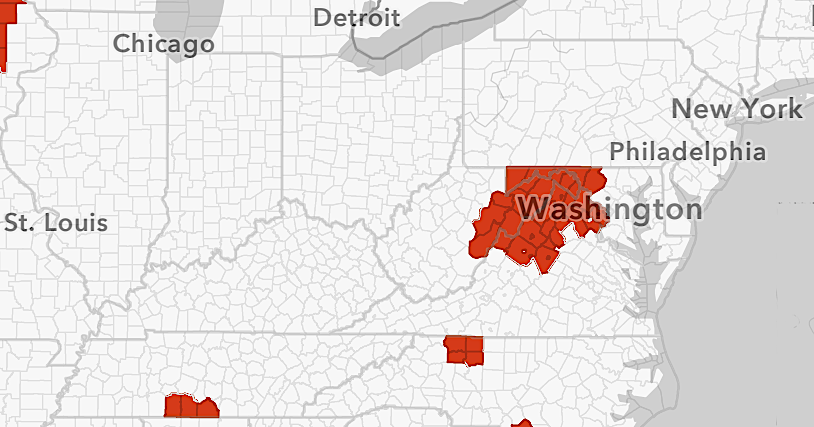
Reduced rainfall caused the Virginia Department of Environmental Quality to declare almost all of Virginia to be in Drought Warning status in June, 2026. Five counties issued mandatory water restrictions.
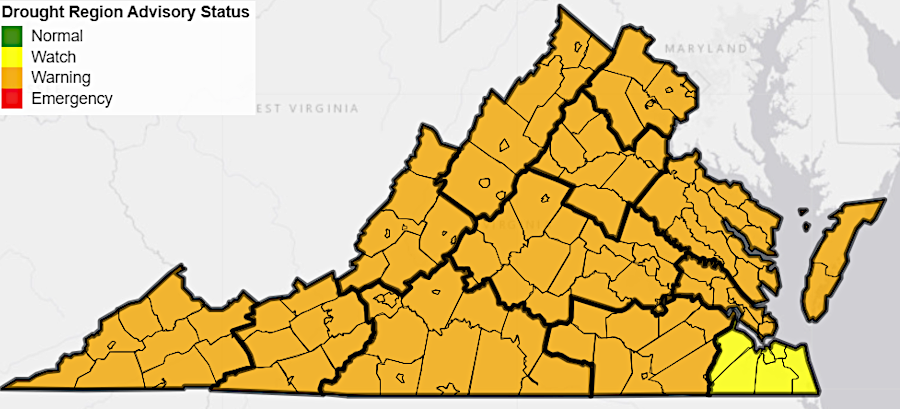
of Virginia's 13 drought regions, only Southeast Virginia was still in Drought Watch status in June 2026
Source: Virginia Department of Environmental Quality (DEQ), Drought Dashboard (June 22, 2026)
Only southern Hampton Roads (Chesapeake, Norfolk, Portsmouth, Suffolk, and Virginia Beach plus Isle of Wight County) was left under a Drought Watch. It was the most significant drought since 2002, and occurred when jurisdictions were beginning to update their water supply plans with a 2029 deadline.12
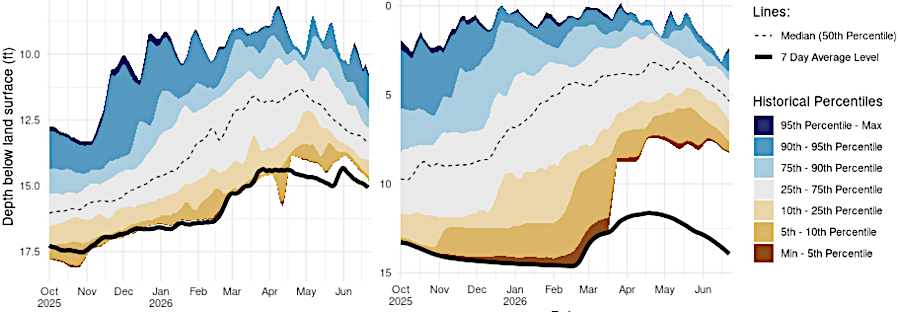
in June 2026, the rolling 7-day average depth in groundwater monitoring wells in Fairfax and Prince William counties was far below average
Source: Virginia Department of Environmental Quality (DEQ), Drought Dashboard (Well 385638077220101 and 383423077245901, June 22, 2026)
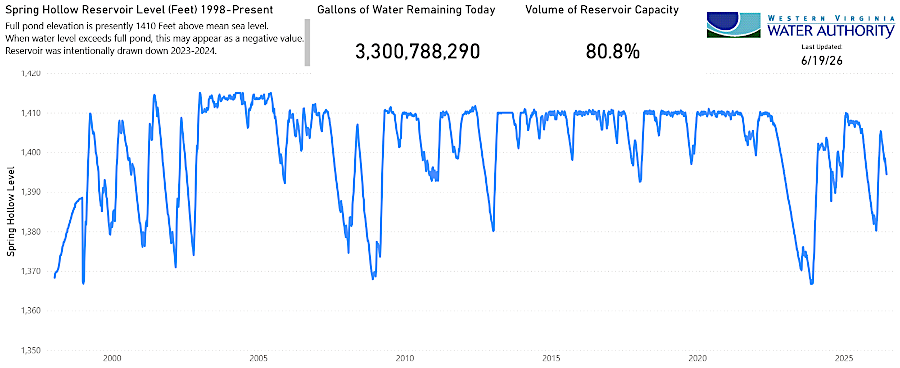
the Spring Hollow Reservoir near Roanoke was at 80% capacity in June, 2026
Source: Western Virginia Water Authority, Reservoir Levels (June 22, 2026)
by 2002 a drought was serious enough to trigger the state government to require creation of long-range water supply plans
Source: National Oceanic and Atmospheric Administration (NOAA), Climate at a Glance - County Mapping