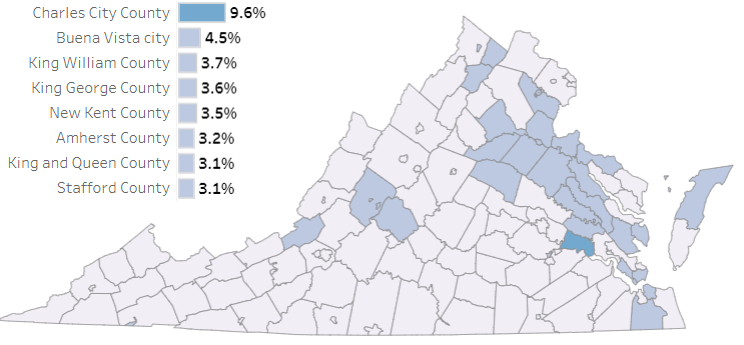
in 2020, Charles City County had the highest percentage of the population identifying as "American Indian or Alaska Native Alone or in Combination"
Source: Bureau of Census, Virginia Adds More Than 600,000 People Since 2010
in 2020, Charles City County had the highest percentage of the population identifying as "American Indian or Alaska Native Alone or in Combination"
Source: Bureau of Census, Virginia Adds More Than 600,000 People Since 2010
Native American tribes and individual Native Americans are still part of Virginia today. For the last 18,000 years, Native Americans have lived in Virginia. The European colonists dramatically disrupted the societies they encountered, but Native Americans have lived in Virginia ever since the Ice Age.
In 2016, the Bureau of Census estimated there were 29,225 Virginia residents who identified as "American Indian and Alaska Native."1
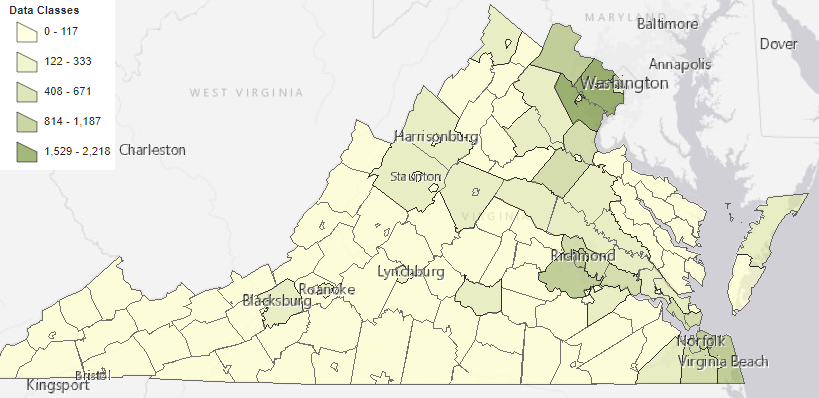
most people who identify as American Indian and Alaska Native live in Northern Virginia now
Source: Bureau of Census, 2012-2016 American Community Survey 5-Year Estimates, Thematic Map of Estimate; RACE - One race - American Indian and Alaska Native
Geography: by County
There was a massive demographic impact to Native American populations after permanent English settlement began in 1607. The exact numbers are less clear than the impact, but there may have been 50,000 or so Native Americans in Virginia in 1607. About 15,000 Algonquians lived under Powhatan's control in Tsenacommacah, and perhaps 10,000 others on the Coastal Plain.
As a result of the demographic changes since the Europeans arrived and legalized discrimination, including the Racial Integrity Law of 1924, the Totero, Gingaskin, and many other tribal groups have disappeared as organized communities. All Native American societies were disrupted and populations dramatically decreased. Despite the assults, as one member of the Chickahominy tribe has noted, "Well, we're here. We never left."2
Many died from disease and starvation, after being forced from traditional homelands by colonists seizing land for farms. Others died in direct conflicts with the English. Constant small-scale murder and skirmishes were interrupted by occasional large-scale wars, including major uprisings in 1622 and 1644 and brutal suppression during Bacon's Rebellion in 1676.
Many original Virginians migrated as individuals or family groups to the north, west, or south, away from the encroaching English. They joined the Iroquois, Shawnee, and Cherokee, losing their distinct identity as members in traditional Virginia tribes.
Currently there are 11 state-recognized tribes. All but one are located east of the Blue Ridge. The Monacan use Natural Bridge State Park to display their culture, but most members live in the Blue Ridge rather than in the Valley and Ridge physiographical province.
Around 1920, anthropologist Frank Speck estimated some tribal populations:3
Chickahominy: 400
Mattaponi: 75
Nansemond: 200
Pamunkey: 300
Patawomeck: 150
Powhatan: 15
Rappahannock: 500
Upper Mattaponi: 75
Werowocomoco 100
Wicomoco: 300:
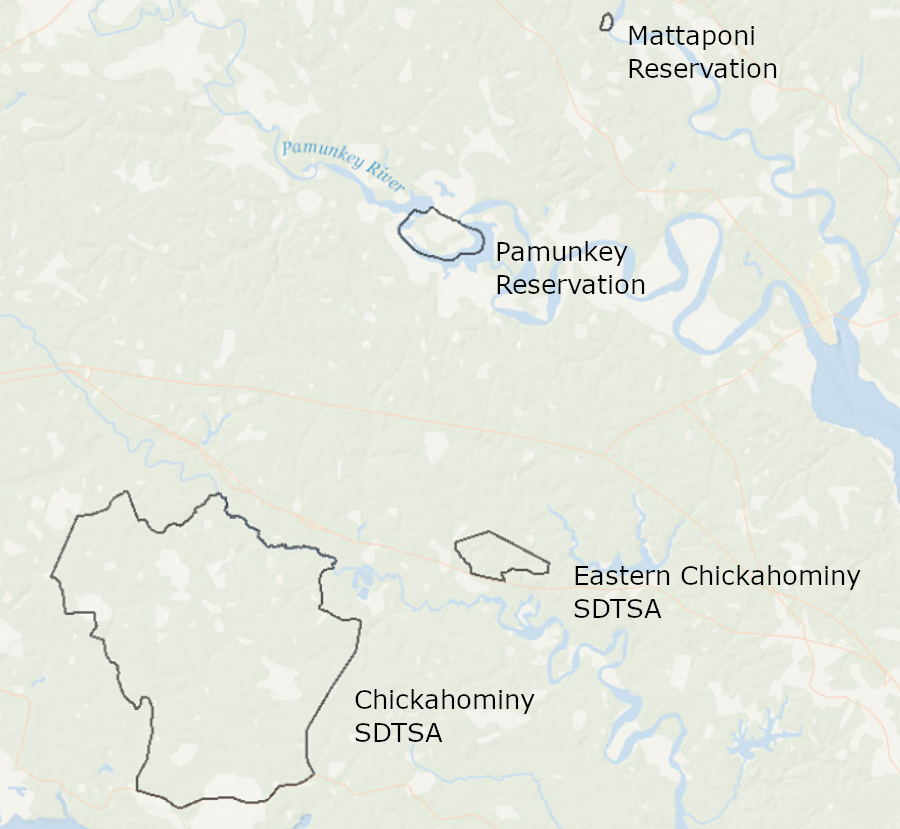
the 2020 Census mapped four places in Virginia as a State Designated Tribal Statistical Area (SDSTA)
Source: Mid-Atlantic Ocean Data Portal
Modern statistics are:4
Most Native Americans in Virginia live, like most other Virginia residents, in the three centers of population - Northern Virginia, Richmond, and Hampton Roads. Those who live "on the reservation" belong to the Pamunkey and Mattaponi tribes.
most Native Americans live in Northern Virginia
Source: Bureau of Census, 2016 American Community Survey 1-Year Supplemental Estimates with a Population Threshold of 20,000 or More, Race
The Pamunkey tribe has just 200 members on its tribal role. Only a small percentage lived on the 1,200-acre reservation in King William County. The 36 families there included 80 people, Nearly 30 are non-native spouses, not entitled to vote on tribal matters.5
The only other state-recognized reservation in Virginia is 150 acres owned by the Mattaponi tribe. About 75 of the 450 members of the Mattaponi tribe live there.6
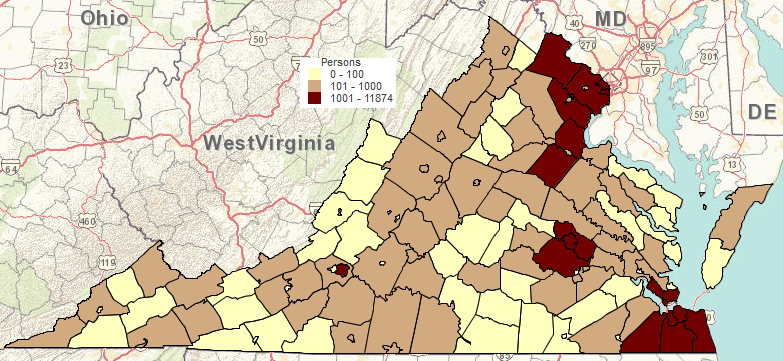
only the three urban centers in Virginia - and the City of Roanoke - have jurisdictions with more than 1,000 people who identify as "American Indian and Alaska Native"
Source: Bureau of Census - 2008-2012 American Community Survey 5-Year Estimates, American Indian And Alaska Native Alone Or In Combination With One Or More Other Races
The 2010 Census counted 36,398 people in Virginia in the "Tribe alone or in any combination" category, and 21,948 people in the "American Indian and Alaskan Native alone" category. Those included people not associated with the state-recognized tribes.7
In 2012, according to the 5-year projection of the Census Bureau's American Community Survey, the Virginia jurisdiction with the highest percentage of "American Indian and Alaska Natives" in the population was Charles City County with 8.3%. Second-highest was King William County, with 2.6%. No other jurisdiction exceeded 2%.8
Total population is different from percentage.
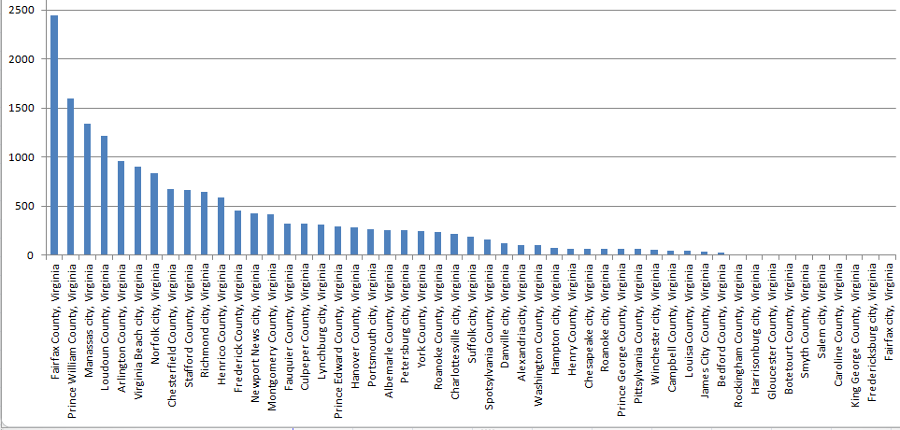
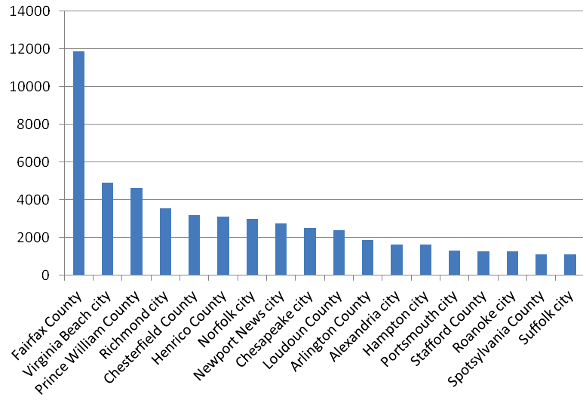
While Charles City County and King William County had the highest percentage of Native Americans in their population, those two counties were not in the top 20 jurisdictions for total number of American Indian and Alaska Natives. Most Native Americans in Virginia live in Northern Virginia, especially Fairfax County. The concentration of Native Americans in the densely-populated regions of the state reflects the migration of non-Virginians into those fast-growing communities, rather than remnant populations that survived from colonial times.
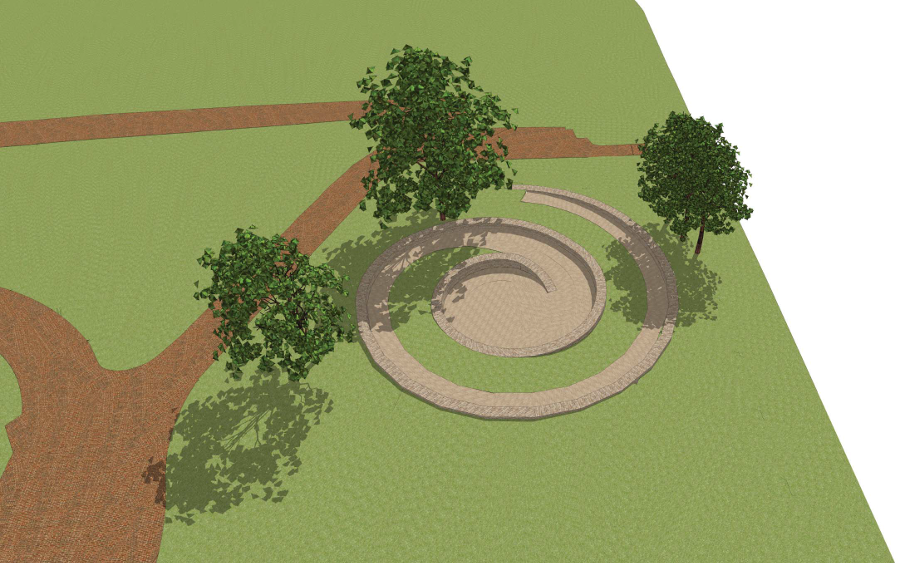
a commemorative site to Virginia's Native Americans was dedicated on Capitol Square in Richmond in 2018
Source: Virginia Indian Memorial Commission, Mantle: A Tribute to Virginia's Tribes
Charles City and King William counties have a high percentage of Native American residents - but are not in the list of Virginia jurisdictions with more than 1,000 people who identify as "American Indian and Alaska Native"
Source: Bureau of Census - 2008-2012 American Community Survey 5-Year Estimates, American Indian And Alaska Native Alone Or In Combination With One Or More Other Races
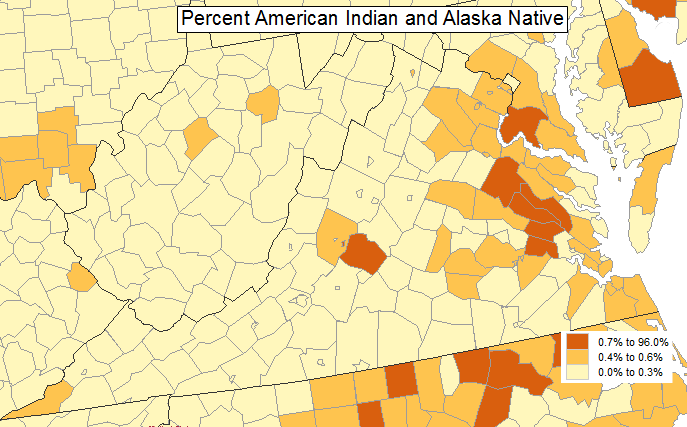
the Virginia jurisdictions with the highest percentage of Native Americans/Alaskan Natives in their population include Amherst County (home of the Monacan tribe), plus several Tidewater counties that were once part of Powhatan's paramount confederacy
Source: Bureau of Census, Census Data Mapper
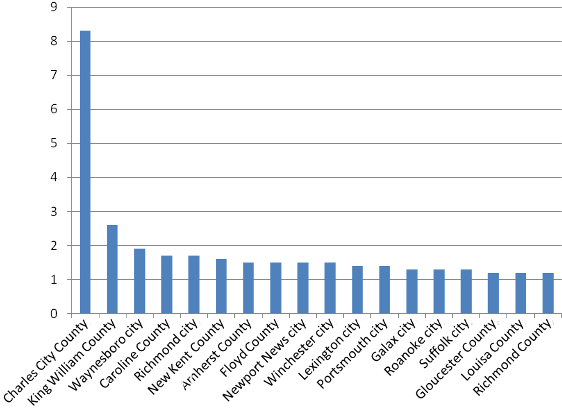
only two counties in Virginia have more than 2% of the population who identify as "American Indian and Alaska Native"
Source: Bureau of Census - 2008-2012 American Community Survey 5-Year Estimates, Demographic And Housing Estimates