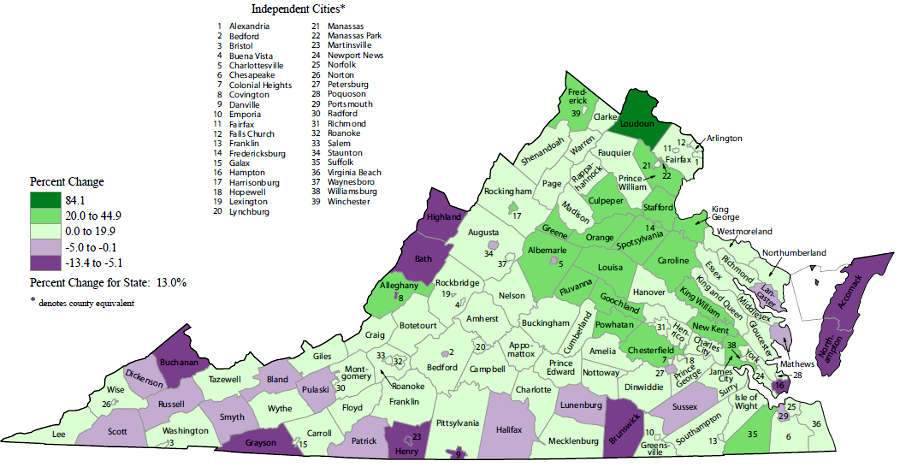
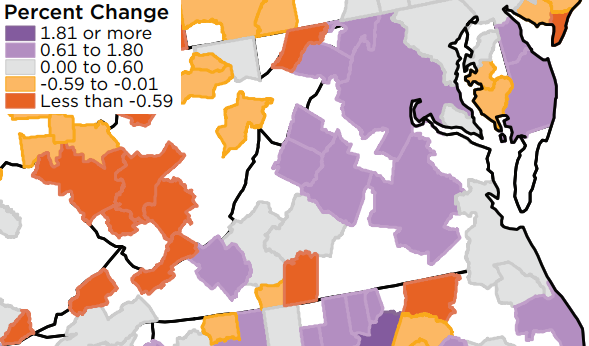
between 2000-2010, Loudoun County was the fastest-growing jurisdiction in Virginia
Source: Bureau of Census Thematic Maps, Percent Change in Population by County: 2000 to 2010
between 2000-2010, Loudoun County was the fastest-growing jurisdiction in Virginia
Source: Bureau of Census Thematic Maps, Percent Change in Population by County: 2000 to 2010
The population of Virginia, especially the counties in Northern Virginia, have not always been growing. The historical census data for Virginia shows population declines as well as increases.
Just after the Revolutionary War (as recorded in the 1790 Census), Virginia statewide had:1
- 292,627 "slaves"
- 12,866 "all Other Free Persons"
- 442,117 "White" people
for a total population total of 747,610.
1790 - Total Virginia Population, showing counties with the largest and smallest number of people
1790 - Total Slave Population, showing counties with the largest and smallest number of slaves
1790 - Slave Percentages By County, showing those counties with the largest and smallest percentage of slaves in the total population
Source: Historical Census Browser, using data from the Inter-university Consortium for Political and Social Research (ICPSR)
Just before the Civil War (in the 1860 Census), the state population had grown to a total of 1,596,206, including:2
- 112 "Indians"
- 490,865"slaves"
- 58,042 "free coloreds"
- 1,047,299 "whites"
for a total population of 1,596,318.
1860 - Total Virginia Population, showing counties with the largest and smallest number of people
1860 - Total Slave Population, showing counties with the largest and smallest number of slaves
1860 - Slave Percentages By County, showing those counties with the largest and smallest percentage of slaves in the total population
Source: Historical Census Browser, using data from the Inter-university Consortium for Political and Social Research (ICPSR)
Contrast that growth pattern with Prince William County. In 1790, Prince William County had:3
- 4,704 "slaves"
- 167 "all Other Free Persons"
- 6,744 "Whites"
for a total of 11,615 people.
Just before the Civil War (in the 1860 Census), the Prince William County population had dropped to only 8,565, including:4
- 2,356 "slaves"
- 519 "free coloreds"
- 5,690 "whites"
Obviously Prince William lost population (over 25% decline...) while the state population more than doubled during those 70 years. The agricultural potential - and low cost - of new lands in Ohio, Kentucky, Mississippi, and further west drew farmers from the worn-out tobacco plantations of the Piedmont. Population growth in Virginia is not steady, or spread evenly across all sections. The increasing population and cultural diversity of Prince William since 1960 is in clear contrast to the county's demographic patterns between the Revolutionary War and the Civil War.
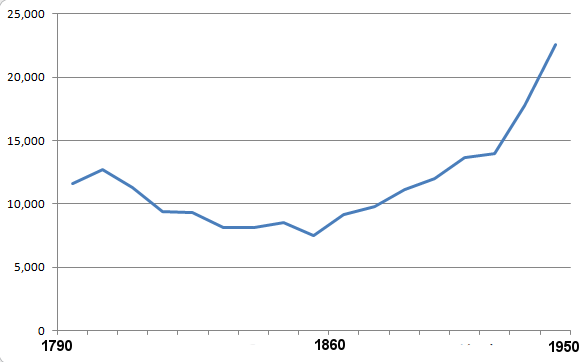
Prince William County lost population between 1800-1850 and in 1860-1870, and by 1950 had only doubled the 1790 population
Source: Bureau of Census, Population of States and Counties of the United States: 1790 to 1990
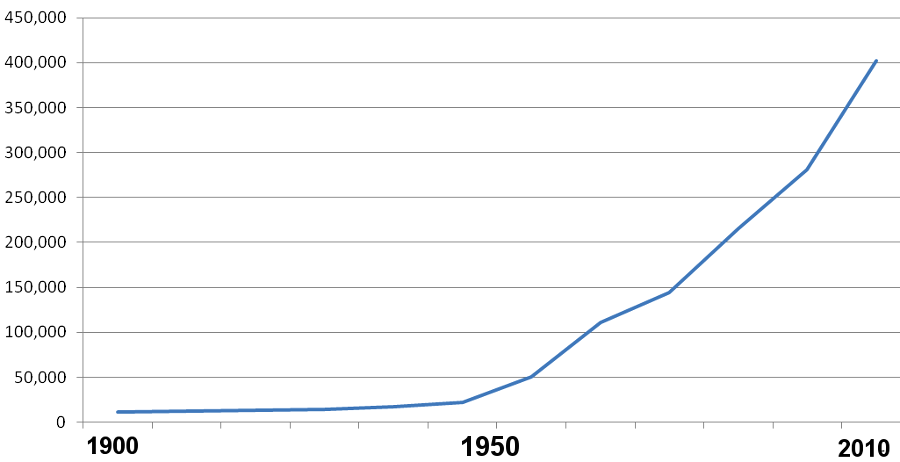
Prince William County grew dramatically after 1950, in contrast to previous years
Source: Bureau of Census, Population of States and Counties of the United States: 1790 to 1990 and American FactFinder
In 1790, 19% of the national population lived in Virginia. Virginia remained the most populous state for 20 more years through the 1810 census, but its percentage of the total population of the United States dropped steadily:5
| Year | Virginia % of
Total Population |
States With the Most People |
|---|---|---|
| 1790 | 18% | VA, PA, NC |
| 1800 | 17% | VA, PA, NY |
| 1810 | 14% | VA, NY, PA |
| 1820 | 11% | PA, NY, VA |
| 1830 | 9% | NY, PA, VA |
| 1840 | 7% | NY, PA, OH, VA |
| 1850 | 6% | NY, PA, OH, VA |
| 1860 | 5% | NY, PA, OH, IL, VA |
| 1870 | 3% | NY, PA, OH, IL, MO,
IN, MA, KY, TN, VA |
When the 13 states ratified the US Constitution to create the modern United States, Virginia had the largest population of any of those 13 states. In 1790, nearly one out of every 5 Americans was a Virginian. Four of the first five presidents were Virginians - Washington, Jefferson, Madison, and Monroe. The "Virginia Dynasty" dominated the national political life for the first 35 years of the United States, until President James Monroe's second term ended in 1824.
Virginia had 19% of the national population in 1790, but Virginia elected only 15% of the members in the House of Representatives. The difference was due to the way slaves were counted for voting representation.
In 1790, 40% of the people in Virginia were slaves in bondage. Under the Constitution ratified in 1788, only three-fifths of the slave population was counted when determining the number of members for each state in the House of Representatives.
That three-fifths formula helped the northern, non-slave states ensure that the southern states could not buy votes when they bought slaves. The Constitution did not defined each enslaved person to be just 60% of a human being; the three-fifths formula for counting non-free people was not designed to diminish the humanity of individuals who were enslaved. The institution of slavery alone was sufficient to do that, by treating people as property that could be abused by slaveowners.
The three-fifths formula was designed to define the political power of slaveowners, in an era long before today's philosophy of "one person-one vote." Enslaved people were not allowed to vote in Southern states, but in Northern as well as Southern states 50% of the white adult population also was blocked from voting simply because of gender.
The convention in Philadelphia was called to establish a political union rather than to address social injustices, but the immorality of holding people in slavery was recognized clearly in 1787. As the three-fifths formula was debated, Gouverneur Morris from New York exclaimed:6
The US Constitution required a census every decade in order to adjust the number of people each state could send to vote in the House of Representatives. In one of the great compromises required to get approval of the Constitution, each state was granted two votes in the US Senate but population levels determined political power in the other half of the Congress.
California is now the most populous state, so it has the greatest number of electoral votes (55). Politicians campaign extensively in that state and rarely visited Virginia, until Virginia became a political battleground in the 2008 presidential election. According to the 2000 Census, California today is not as dominant as Virginia was in 1790. California has only 12% of the total national population now, while Virginia in 1790 had 19% of the national population.7
Source: Virginia Public Access Project (VPAP)
According to a 2012 Weldon Cooper Center population projection, over 10% of Virginia jurisdictions would lose population in the 20 years between 2020 and 2040. Only two of the 17 jurisdictions projected to lose population (City of Virginia Beach and Arlington County) were urban/suburban areas; the other 15 were rural counties.
Of the 17 jurisdictions with the greatest projected population growth, all but two (Bedford County and Montgomery County) were suburban communities or on the edge of suburban sprawl. If the predictions come true, the pattern of population change will increase the existing divide between high-density urbanized metropolitan areas and low-density rural areas. As voting power is concentrated in suburban areas, the allocation of state funding for transportation projects in particular will shift to reflect demographic changes.8
A 2019 assessment of population growth by the Weldon Cooper Center revealed how Northern Virginia, Richmond, and Hampton Roads expanded in population faster than the rest of the state between 2010-2020. Only the jurisdictions with a university (Harrisonburg, Charlottesville/Albemarle, and Radford) were in the top 20 of "fastest growing localities."9
two of the 17 Virginia jurisdictions projected to lose population in the 20 years between 2020 and 2040 are already urban/suburban areas, while 15 of the 17 jurisdictions projected to gain population are already suburban areas or on the periphery of suburban sprawl
Source: University of Virginia Weldon Cooper Center, Virginia Population Projections - Locality, Total Population
Population Statistics for Virginia
1790 - 1800 - 1810 - 1820 - 1830 - 1840 - 1850 - 1860 - 1870 - 1880 - 1890 - 1900 - 1910 - 1920 - 1930 - 1940 - 1950 - 1960 - 1970 - 1980 - 1990 -
2000 - 2010
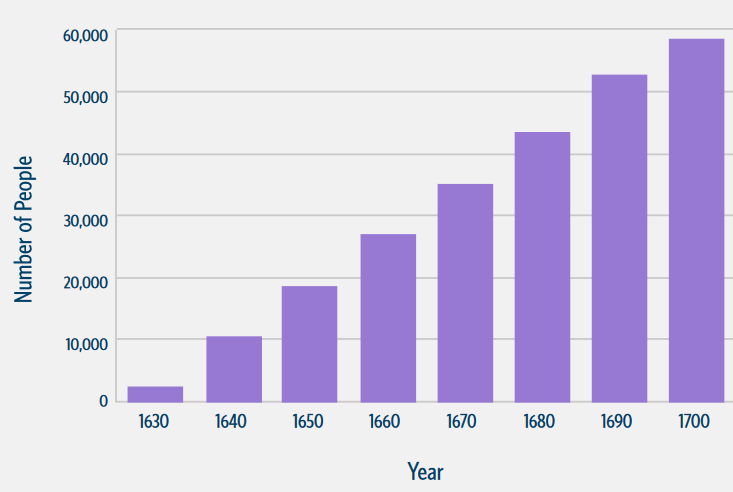
most immigrants to Virginia in the 1600's came from England, but enslaved people were brought involuntarily
Source: Bureau of Census, Jamestown - Factors Affecting Population Change, 1630-1700 (Teacher's Version, p.9)
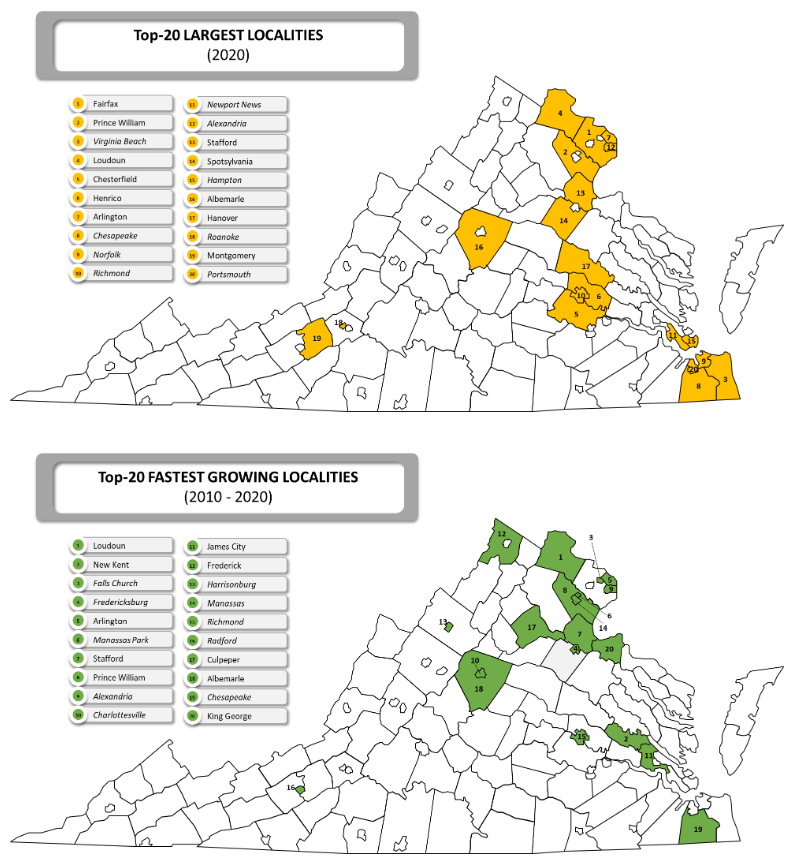
west of the Blue Ridge, population expanded fast between 2010-2020 only in communities with universities and in Frederick County, as it became more linked to Northern Virginia
Source: StatChat, Population Projections show that Virginia is aging and growing more slowly
population growth in urban areas between 2017-18 was in contrast to declines in Southside and Southwest Virginia
Source: Bureau of Census, Where the Population is Changing (2017-2018)
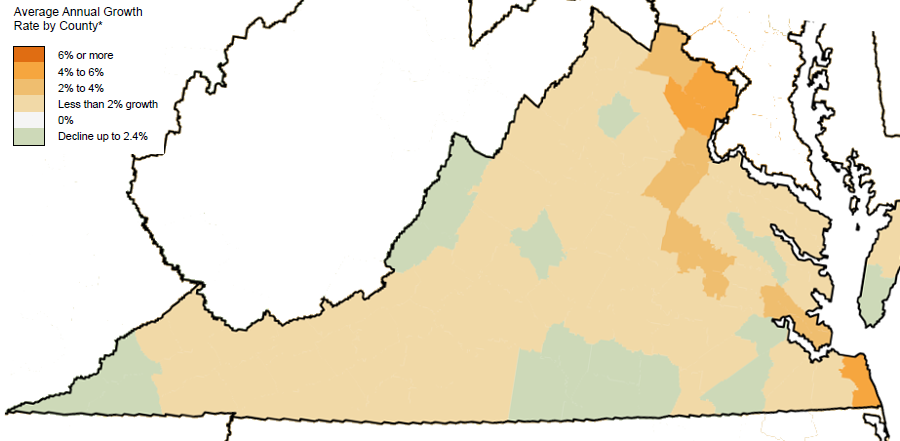
between the Great Depression and the end of the Cold War (1930-2000), Virginia's population growth was concentrated in the crescent between Northern Virginia-Richmond-Hampton Roads
Source: Bureau of Census, Average Annual Percent of Population Growth by County: 1930 to 2000
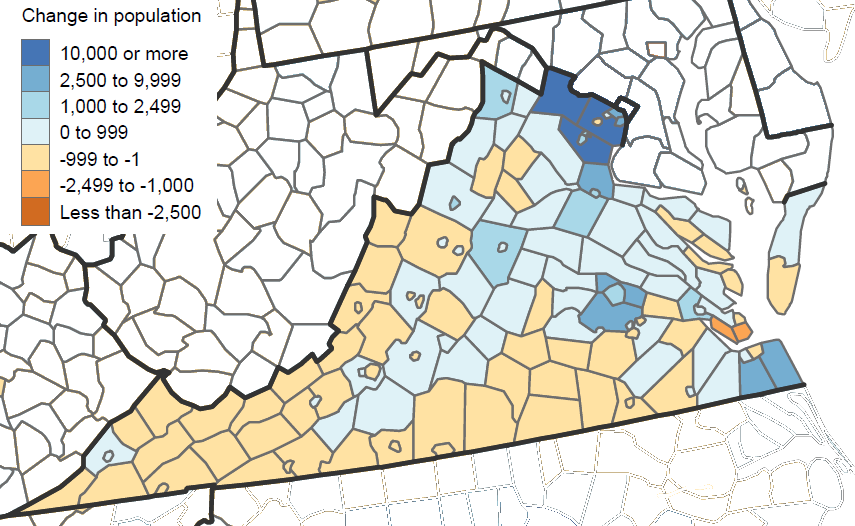
in the year after the 2010 Census, population declined in most rural Virginia counties
and grew in the Hampton Roads-Richmond-Northern Virginia corridor, and in the Piedmont north of the James River
Source: Bureau of Census, Numeric Change in Population for Counties and
Puerto Rico Municipios: April 1, 2010 to July 1, 2011
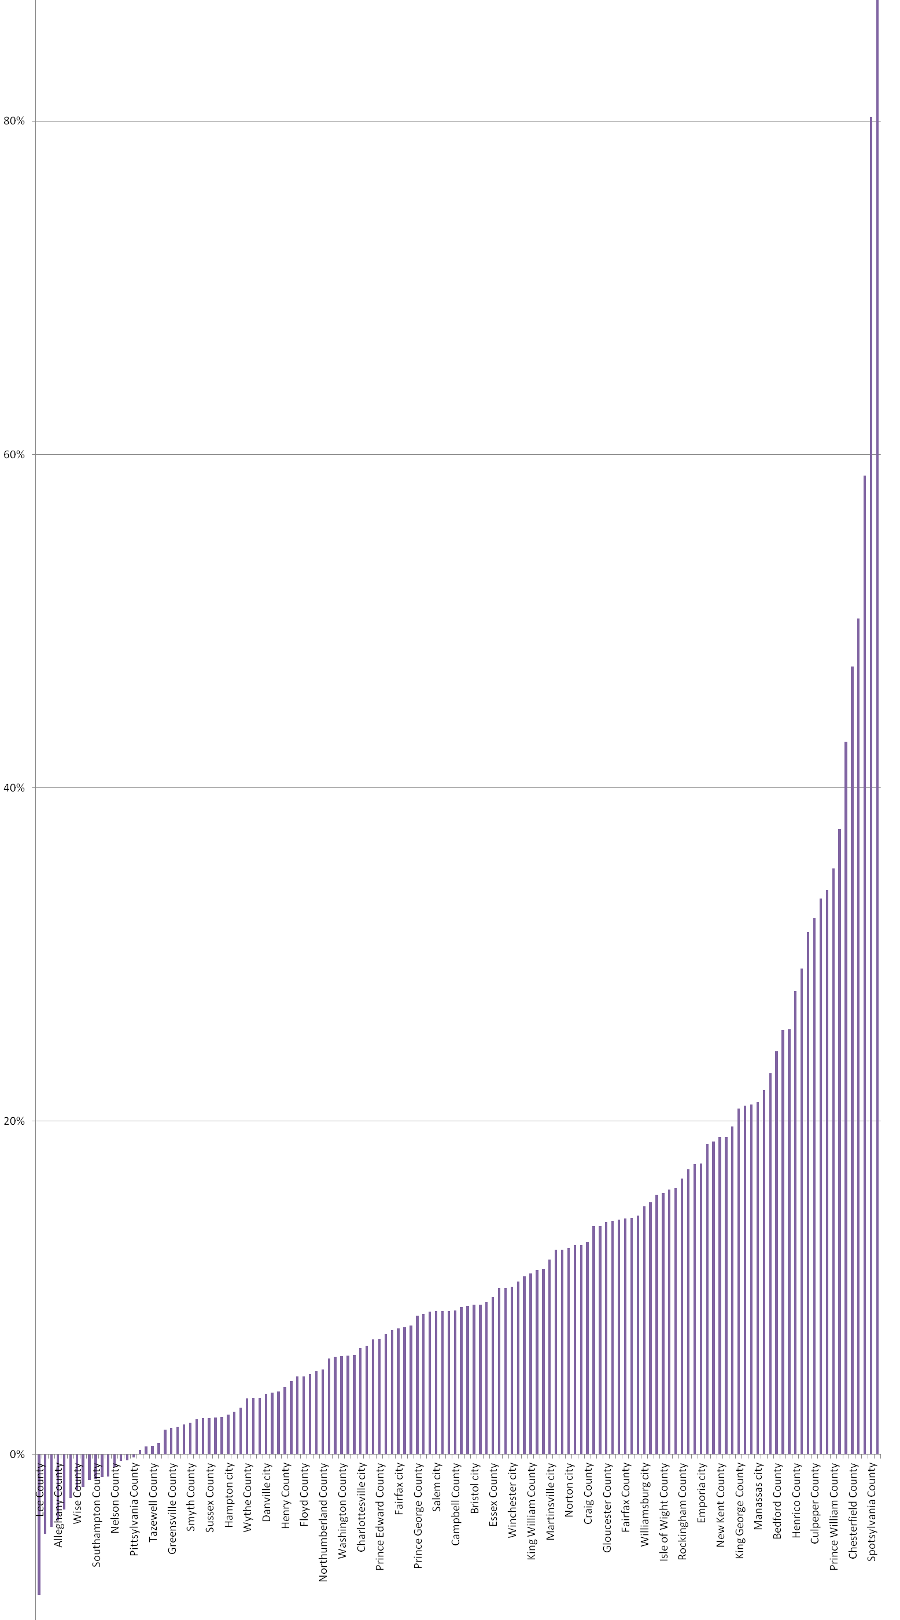
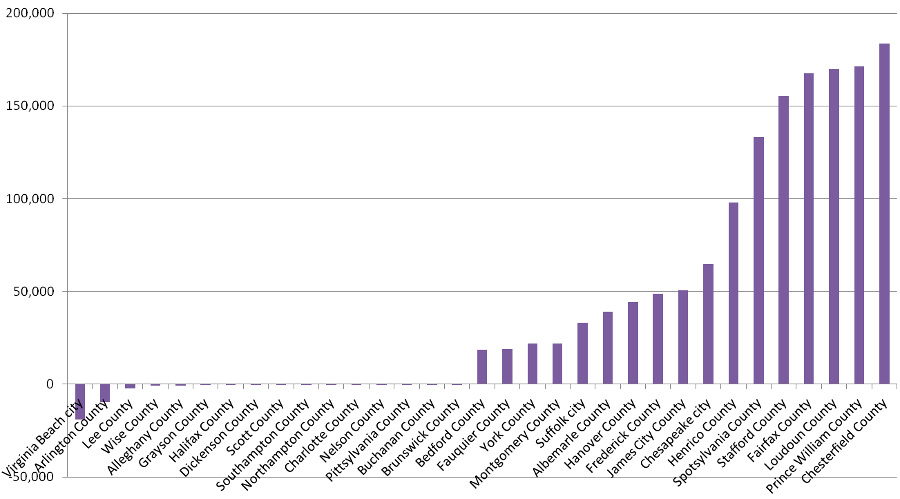
up to 2040, population changes in different jurisdictions are projected to range from an 8% decrease in Lee County to an 87% increase in Spotsylvania County
Source: University of Virginia, Weldon Cooper Center, Virginia Population Projections